
Ultimate Volumetric Price Action Dashboard: Smart Order Blocks, Trend Pulse & Order Flow
A professional-grade all-in-one trading toolkit for TradingView that combines Volumetric Supply/Demand zones, a high-precision Trend Strength Gauge, and a real-time Order Flow Volume Profile. Designed for institutional-level market analysis.
Master the Markets with Volumetric Precision
In the modern trading landscape, price action alone isn’t enough. Professional traders need to see the liquidity and momentum driving those price movements. The Price Action Volumetric OB & Trend Strength indicator is a sophisticated ecosystem designed to give you a complete 360-degree view of market dynamics.
Key Features:
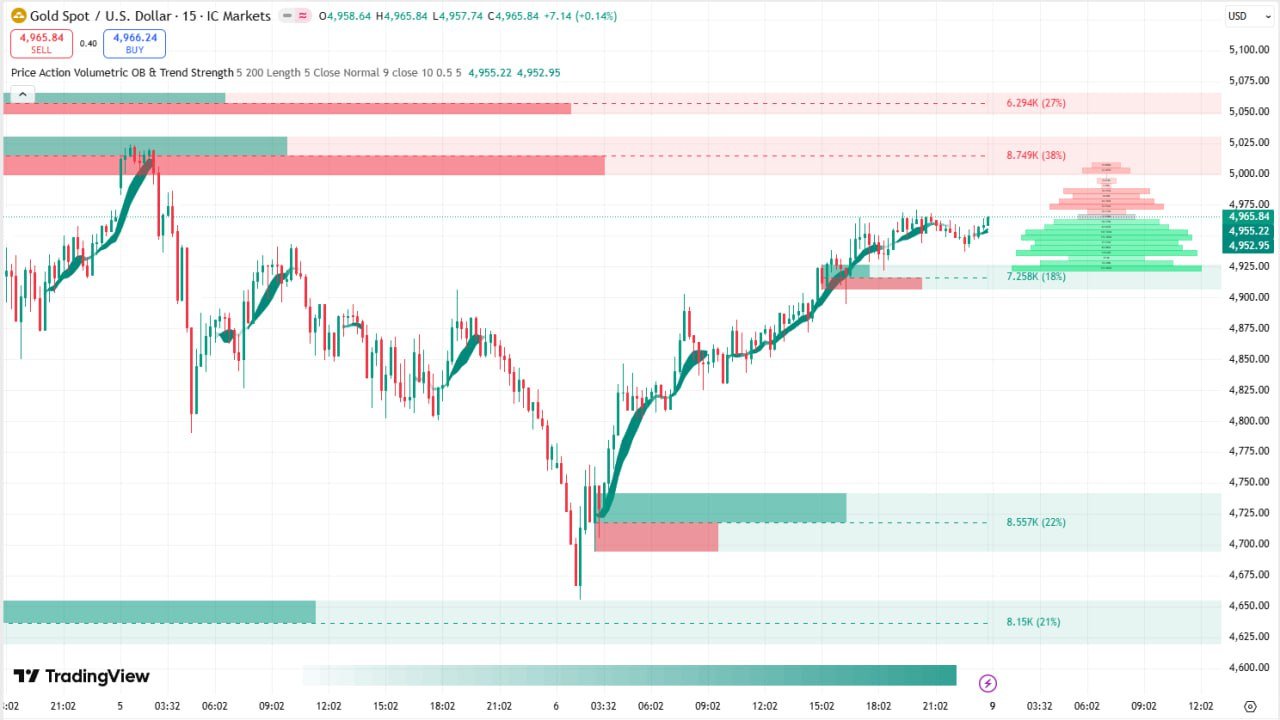
Volumetric Order Blocks: Unlike standard support and resistance, these zones are identified using institutional footprints. Every block shows internal Buy/Sell activity, letting you know if a zone is backed by aggressive buyers or sellers.
Dynamic Trend Strength Gauge: Stop guessing if a trend is fading. Our proprietary HSMA (Hybrid Simple Moving Average) engine calculates the exact momentum of the market, visualized through a sleek dashboard and gradient fills on your chart.
Institutional Order Flow Profile: On the right side of your chart, the indicator builds a real-time Volume Orderbook. It tracks historical volume at every price level, highlighting “Points of Control” (POC) where big players are positioning themselves.
Smart Mitigation Tracking: The indicator automatically tracks when zones are “tested” by price and can remove them based on your choice of “Close,” “Wick,” or “Average” price interaction.
Whether you are a scalper looking for high-probability entries or a swing trader following the smart money, this toolkit provides the clarity needed to trade with confidence.
4. Technical Deep Dive: Line-by-Line Code Analysis
Here is a comprehensive breakdown of the Pine Script logic powering this indicator.
I. Setup and Inputs (Lines 1-43)
Lines 4-5: Sets Pine Script version 5 and initializes the indicator with high resource limits (max_bars_back, max_boxes_count, etc.) to ensure smooth rendering of complex graphics.
Lines 11-13: Defines standard institutional colors: Teal for bullish, Red for bearish.
Lines 21-36: User inputs for customization. This includes the “Mitigation Method” (how zones disappear) and “Overlap” settings to keep the chart clean.
II. Custom Data Structures (Lines 44-81)
The script uses Object-Oriented Programming (OOP) for efficiency:
type bar: Captures OHLV data for specific candles to calculate historical areas.
type ob: Stores the DNA of an Order Block, including its volume, direction, and coordinates for internal buy/sell histogram rendering.
type alert & cross: Tracks states to trigger TradingView alerts only when specific conditions (like price entering a zone) are met.
III. Visual Rendering Methods (Lines 82-166)
method display(): This is the graphics engine. It uses box.new to draw the zones. It also features a nested loop to calculate the “Metric Percentage” of volume compared to recent history.
method overlap(): A cleanup algorithm that identifies overlapping zones and removes the older, less relevant ones.
method umt(): Updates the “Volumetric Activity” visualization (the buying/selling splits inside the block) as time progresses.
IV. Order Block Logic Engine (Lines 167-283)
The fnOB() function is the core logic:
Lines 172-176: Uses ta.pivothigh and ta.highest to find structural turning points.
Lines 180-181: Calculates the zone width. If “Length” mode is selected, it uses ATR (Average True Range) to define the zone bounds; otherwise, it uses the full candle body.
Lines 199-224 (Mitigation): A vital section that checks every active zone against incoming price data. If the price crosses the “Mitigation Level,” the zone is deleted from the active array.
V. Trend Strength Gauge (Lines 284-338)
Lines 289-293: Calculates the “Diff” between a 3-period weighted calculation and a standard SMA.
Lines 301-305: Performs Data Normalization. It scales the difference to a value between -1 and 1 based on the recent 100-bar range.
Lines 309-320: Uses color.from_gradient to create a visual “heat map” of trend strength, both on the price lines and in the bottom dashboard table.
VI. Volume Orderbook – Order Flow (Lines 340-520)
Lines 352-364: Initializes arrays to store volume at specific price levels.
Lines 367-399: Sets up the “grid.” It pre-calculates price steps based on the user’s “Width” input.
Lines 402-431 (The Accumulator): This is the “heavy lifting.” For every price movement, it identifies the correct “bucket” in the array and adds the current volume to it.
Lines 446-520 (Rendering): On the last bar, the script loops through the volume arrays, sorts them, and draws a horizontal histogram on the right. The “POC” (Point of Control) is highlighted using an extended line.
Related Products

Dual Structural Trendline Fib Channel Free Download
Dual Structural Trendline Fib Channel is a structural analysis indicator that automatically constructs dual trendline channels using pivot-based slope logic.
![Wedge Pattern [InfinityAlgo] Free Download](https://infinityalgoacademy.net/wp-content/uploads/2026/02/Wedge-Pattern-UAlgo-—-Indicator-by-UAlgo-—-TradingView-22-02-2026_21_34-scaled.png)
Wedge Pattern [InfinityAlgo] Free Download
Wedge Pattern is a chart overlay that detects rising and falling wedge formations using strict pivot based rules and a validation engine that enforces classic technical analysis requirements. The script builds two trendlines from confirmed pivot highs and pivot lows

Volatility Aggregation Model Tradingview
Volatility Aggregation Model (VAM) is a very simple overlay indicator that classifies market direction using a five-speed ensemble of volatility-adaptive range engines. Instead of relying on a single trend filter, VAM evaluates direction across multiple responsiveness settings and converts those states into a normalized score
Quantum Emperor MT4 Free Download
Introducing Quantum Emperor EA, the groundbreaking MQL5 expert advisor that's transforming the way you trade the prestigious GBPUSD pair! Developed by a team of experienced traders with trading experience of over 13 years.
CyNera MT4 Free Download
Trading gold, one of the most volatile instruments in the market, demands precision, in-depth analysis, and strong risk management. CyNera Expert Advisor seamlessly integrates these elements into a sophisticated system designed for optimal gold trading.