
![Targets For Overlay Indicators [LuxAlgo]](https://infinityalgoacademy.net/wp-content/uploads/2026/02/Targets-For-Overlay-Indicators-LuxAlgo-scaled.png)
Targets For Overlay Indicators [LuxAlgo]
The Targets For Overlay Indicators is a useful utility tool able to display targets during crossings made between the price and external indicators on the user chart. Users can display a series of two targets, one for crossover events and another one for crossunder event.
The Targets For Overlay Indicators is a useful utility tool able to display targets during crossings made between the price and external indicators on the user chart. Users can display a series of two targets, one for crossover events and another one for crossunder event.
Alerts are included for the occurrence of a new target as well as for reached targets.
🔶 USAGE
In order for targets to be displayed users need to select an appropriate input source from the “Source” drop-down input setting. In the example above we apply the indicator to a volatility stop.
This can also easily be done by adding the “Targets For Overlay Indicators” script on the VStop indicator directly.
Targets can help users determine the price limit where the price might start deviating from an indication given by one or multiple indicators. In the context of trading, targets can help secure profits/reduce losses of a trade, as such this tool can be useful to evaluate/determine user take profits/stop losses.
Due to these essentially being horizontal levels, they can also serve as potential support/resistances, with breakouts potentially confirming new trends.
Users might be interested in obtaining new targets once one is reached, this can be done by enabling “New Target When Reached” in the target logic setting section, resulting in more frequent targets.
Lastly, users can restrict new target creation until current ones are reached. This can result in fewer and longer-term targets, with a higher reach rate.
🔹Examples
The indicator can be applied to many overlay indicators that naturally produce crosses with the price, such as moving average, trailing stops, bands…etc.
Users can use trailing stops such as the SuperTrend or VStop to more easily create clean targets. Do note that certain SuperTrend scripts separate the upper and lower extremities of the SuperTrend into two different plot, which cannot be used with this tool, you may use the provided SuperTrend script below to have a compatible version with our tool:
Using moving averages can produce more targets than other overlay indicators.
Users can apply the tool twice when using bands or any overlay indicator returning two outputs, using crossover targets for obtaining targets using the upper band as source and crossunder targets for targets using the lower band. We can also use the Trendlines with breaks indicator as example:
🔹Dashboard
A dashboard is displayed on the top right of the chart, displaying the amount, reach rate of targets 1/2, and total amount.
This dashboard can be useful to evaluate the selected target distances relative to the selected conditions, with a higher reach rate suggesting the distance of the targets from the price allows them to be reached.
🔶 SETTINGS
- Source: Indicator source used to create targets. Targets are created when the closing price crosses the specified source.
- Show Target Labels: Display target labels on the chart.
- Candle Coloring: Apply candle coloring based on the most recent active target.
🔹Target
Crossover and Crossunder targets use the same settings below:
- Show Target: Determines if the target is displayed or not.
- Above Price Target: If selected, will create targets above the closing price.
- Wait Until Reached: When enabled will not create a new target until an existing one is reached.
- New Target When Reached: Will create a new target when an existing one is reached.
- Evaluate Wicks: Will use high/low prices to determine if a target is reached. Unselecting this setting will use the closing price.
- Target Distance From Price: Controls the distance of a target from the price. Can be determined in currencies/points, percentages, ATR multiples, or ticks.
Related Products

Dual Structural Trendline Fib Channel Free Download
Dual Structural Trendline Fib Channel is a structural analysis indicator that automatically constructs dual trendline channels using pivot-based slope logic.
![Wedge Pattern [InfinityAlgo] Free Download](https://infinityalgoacademy.net/wp-content/uploads/2026/02/Wedge-Pattern-UAlgo-—-Indicator-by-UAlgo-—-TradingView-22-02-2026_21_34-scaled.png)
Wedge Pattern [InfinityAlgo] Free Download
Wedge Pattern is a chart overlay that detects rising and falling wedge formations using strict pivot based rules and a validation engine that enforces classic technical analysis requirements. The script builds two trendlines from confirmed pivot highs and pivot lows

Volatility Aggregation Model Tradingview
Volatility Aggregation Model (VAM) is a very simple overlay indicator that classifies market direction using a five-speed ensemble of volatility-adaptive range engines. Instead of relying on a single trend filter, VAM evaluates direction across multiple responsiveness settings and converts those states into a normalized score
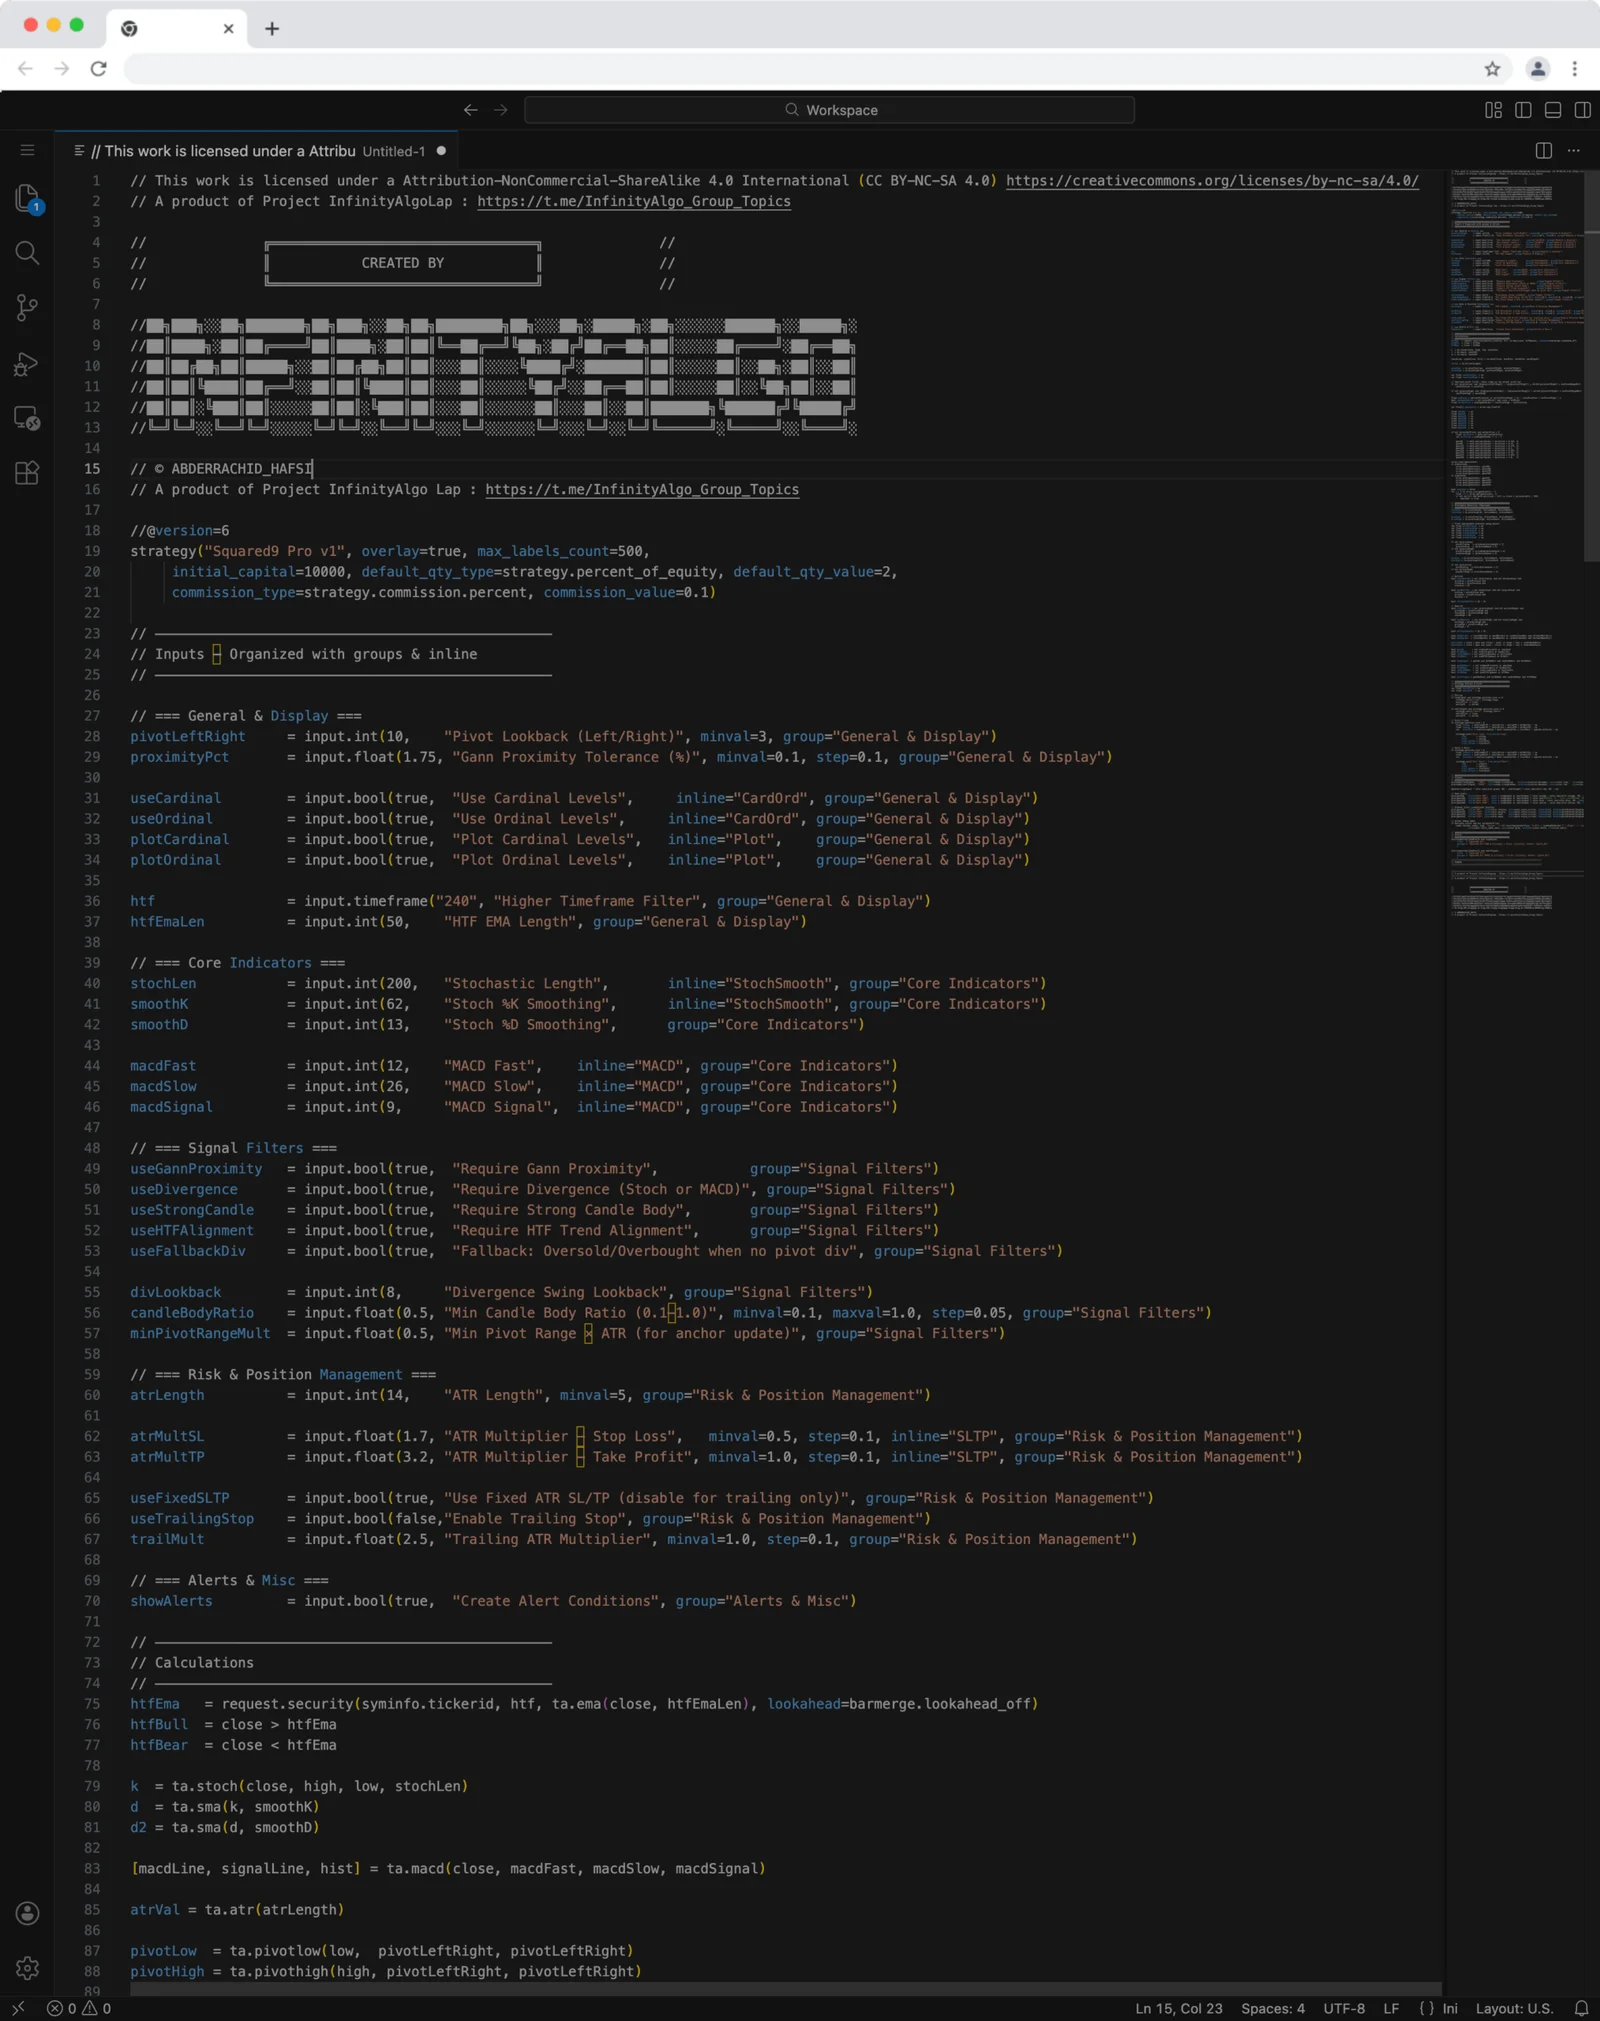
Squared9 Pro v1 Tradingview Free Download - PineScript
Squared9 Pro v1.0 (strategy) combines classic Gann geometry with modern momentum checks to find high-conviction reversal zones.
![Impulse Trend Levels [InfinityAlgo]](https://infinityalgoacademy.net/wp-content/uploads/2026/02/Impulse-Trend-Levels-BOSWaves-—-Indicator-by-BOSWaves-—-TradingView-19-02-2026_19_05-scaled.png)
Impulse Trend Levels [InfinityAlgo]
Impulse Trend Levels [InfinityAlgo] is a momentum-aware trend identification system that tracks directional price movement through adaptive confidence bands, where band width dynamically adjusts based on impulse strength and freshness to reflect real-time conviction in the current trend direction.