
![Support & Resistance Zones Strength Classifier [LuxAlgo]](https://infinityalgoacademy.net/wp-content/uploads/2026/02/Support-Resistance-Zones-Strength-Classifier-LuxAlgo-—-Indicator-by-LuxAlgo-17-02-2026_20_34-scaled.png)
Support & Resistance Zones Strength Classifier [LuxAlgo]
The Support & Resistance Zones Strength Classifier indicator is a technical tool designed to identify and visualize key market levels by grouping pivot points into dynamic zones that adapt to price action. It emphasizes zone "strength" by tracking the number of times level is tested and automatically removes zones that have been breached by price
The Support & Resistance Zones Strength Classifier indicator is a technical tool designed to identify and visualize key market levels by grouping pivot points into dynamic zones that adapt to price action. It emphasizes zone “strength” by tracking the number of times a level is tested and automatically removes zones that have been breached by price.
🔶 USAGE
This indicator identifies potential areas of supply and demand based on historical pivot highs and lows. Instead of displaying a single line for every pivot, it consolidates nearby price points into cohesive zones, making it easier to visualize significant levels of interest.
🔹 Strength Classification
Zones are visually classified based on their “test count.” A zone is created when a pivot is detected, and its count increases every time price returns to that area without breaking through it.
- Weak/New Zones: Displayed with higher transparency to indicate they have not yet been established as significant.
- Strong/Tested Zones: Displayed with higher opacity and a clear test count label (if enabled) to highlight levels where the market has historically reacted multiple times.
🔹 Dynamic Zone Management
The tool actively manages the chart real-estate by:
- Merging: If two zones overlap, they are merged into a single, wider zone, and their test counts are combined.
- Breakout Deletion: If a candle close penetrates the boundary of a support (below) or resistance (above) zone, that zone is considered “broken” and is immediately removed from the chart.
-
- Resistance zones turn into potential support once broken (though this specific script focuses on current active boundaries).
- Support zones act as floors until a close below occurs.
🔶 DETAILS
The script calculates zone thickness using a volatility-adjusted distance (average bar range). This ensures that zones on a high-volatility asset like Bitcoin are proportionally thicker than zones on a low-volatility asset like a stablecoin or a blue-chip stock.
The “Pivot Lookback” setting determines the sensitivity of the detection. A higher lookback will identify major swing points but may ignore intraday fluctuations, while a lower lookback will create more frequent, smaller zones.
🔶 SETTINGS
🔹 Calculation
- Pivot Lookback: The number of bars required on each side of a high or low to confirm a pivot point.
- Zone Width (dist Multiplier): Multiplier applied to the average bar range to determine the vertical thickness of new zones.
- Minimum Tests to Highlight: The number of touches required before a zone is drawn with higher visibility/opacity.
- Max Active Zones Per Type: Limits the total number of support and resistance zones maintained on the chart to prevent clutter.
- Max Zone Height (dist Multiplier): A safety threshold that deletes zones if they become too wide due to excessive merging.
🔹 Visuals
- Support/Resistance Colors: Customizable colors for the bullish (support) and bearish (resistance) areas.
- Show Test Count Labels: Toggles the visibility of the numerical label showing how many times a zone was tested.
- Extend Zones to Right: Continues the zone boxes to the most recent bar on the chart.
Related Products

Dual Structural Trendline Fib Channel Free Download
Dual Structural Trendline Fib Channel is a structural analysis indicator that automatically constructs dual trendline channels using pivot-based slope logic.
![Wedge Pattern [InfinityAlgo] Free Download](https://infinityalgoacademy.net/wp-content/uploads/2026/02/Wedge-Pattern-UAlgo-—-Indicator-by-UAlgo-—-TradingView-22-02-2026_21_34-scaled.png)
Wedge Pattern [InfinityAlgo] Free Download
Wedge Pattern is a chart overlay that detects rising and falling wedge formations using strict pivot based rules and a validation engine that enforces classic technical analysis requirements. The script builds two trendlines from confirmed pivot highs and pivot lows

Volatility Aggregation Model Tradingview
Volatility Aggregation Model (VAM) is a very simple overlay indicator that classifies market direction using a five-speed ensemble of volatility-adaptive range engines. Instead of relying on a single trend filter, VAM evaluates direction across multiple responsiveness settings and converts those states into a normalized score
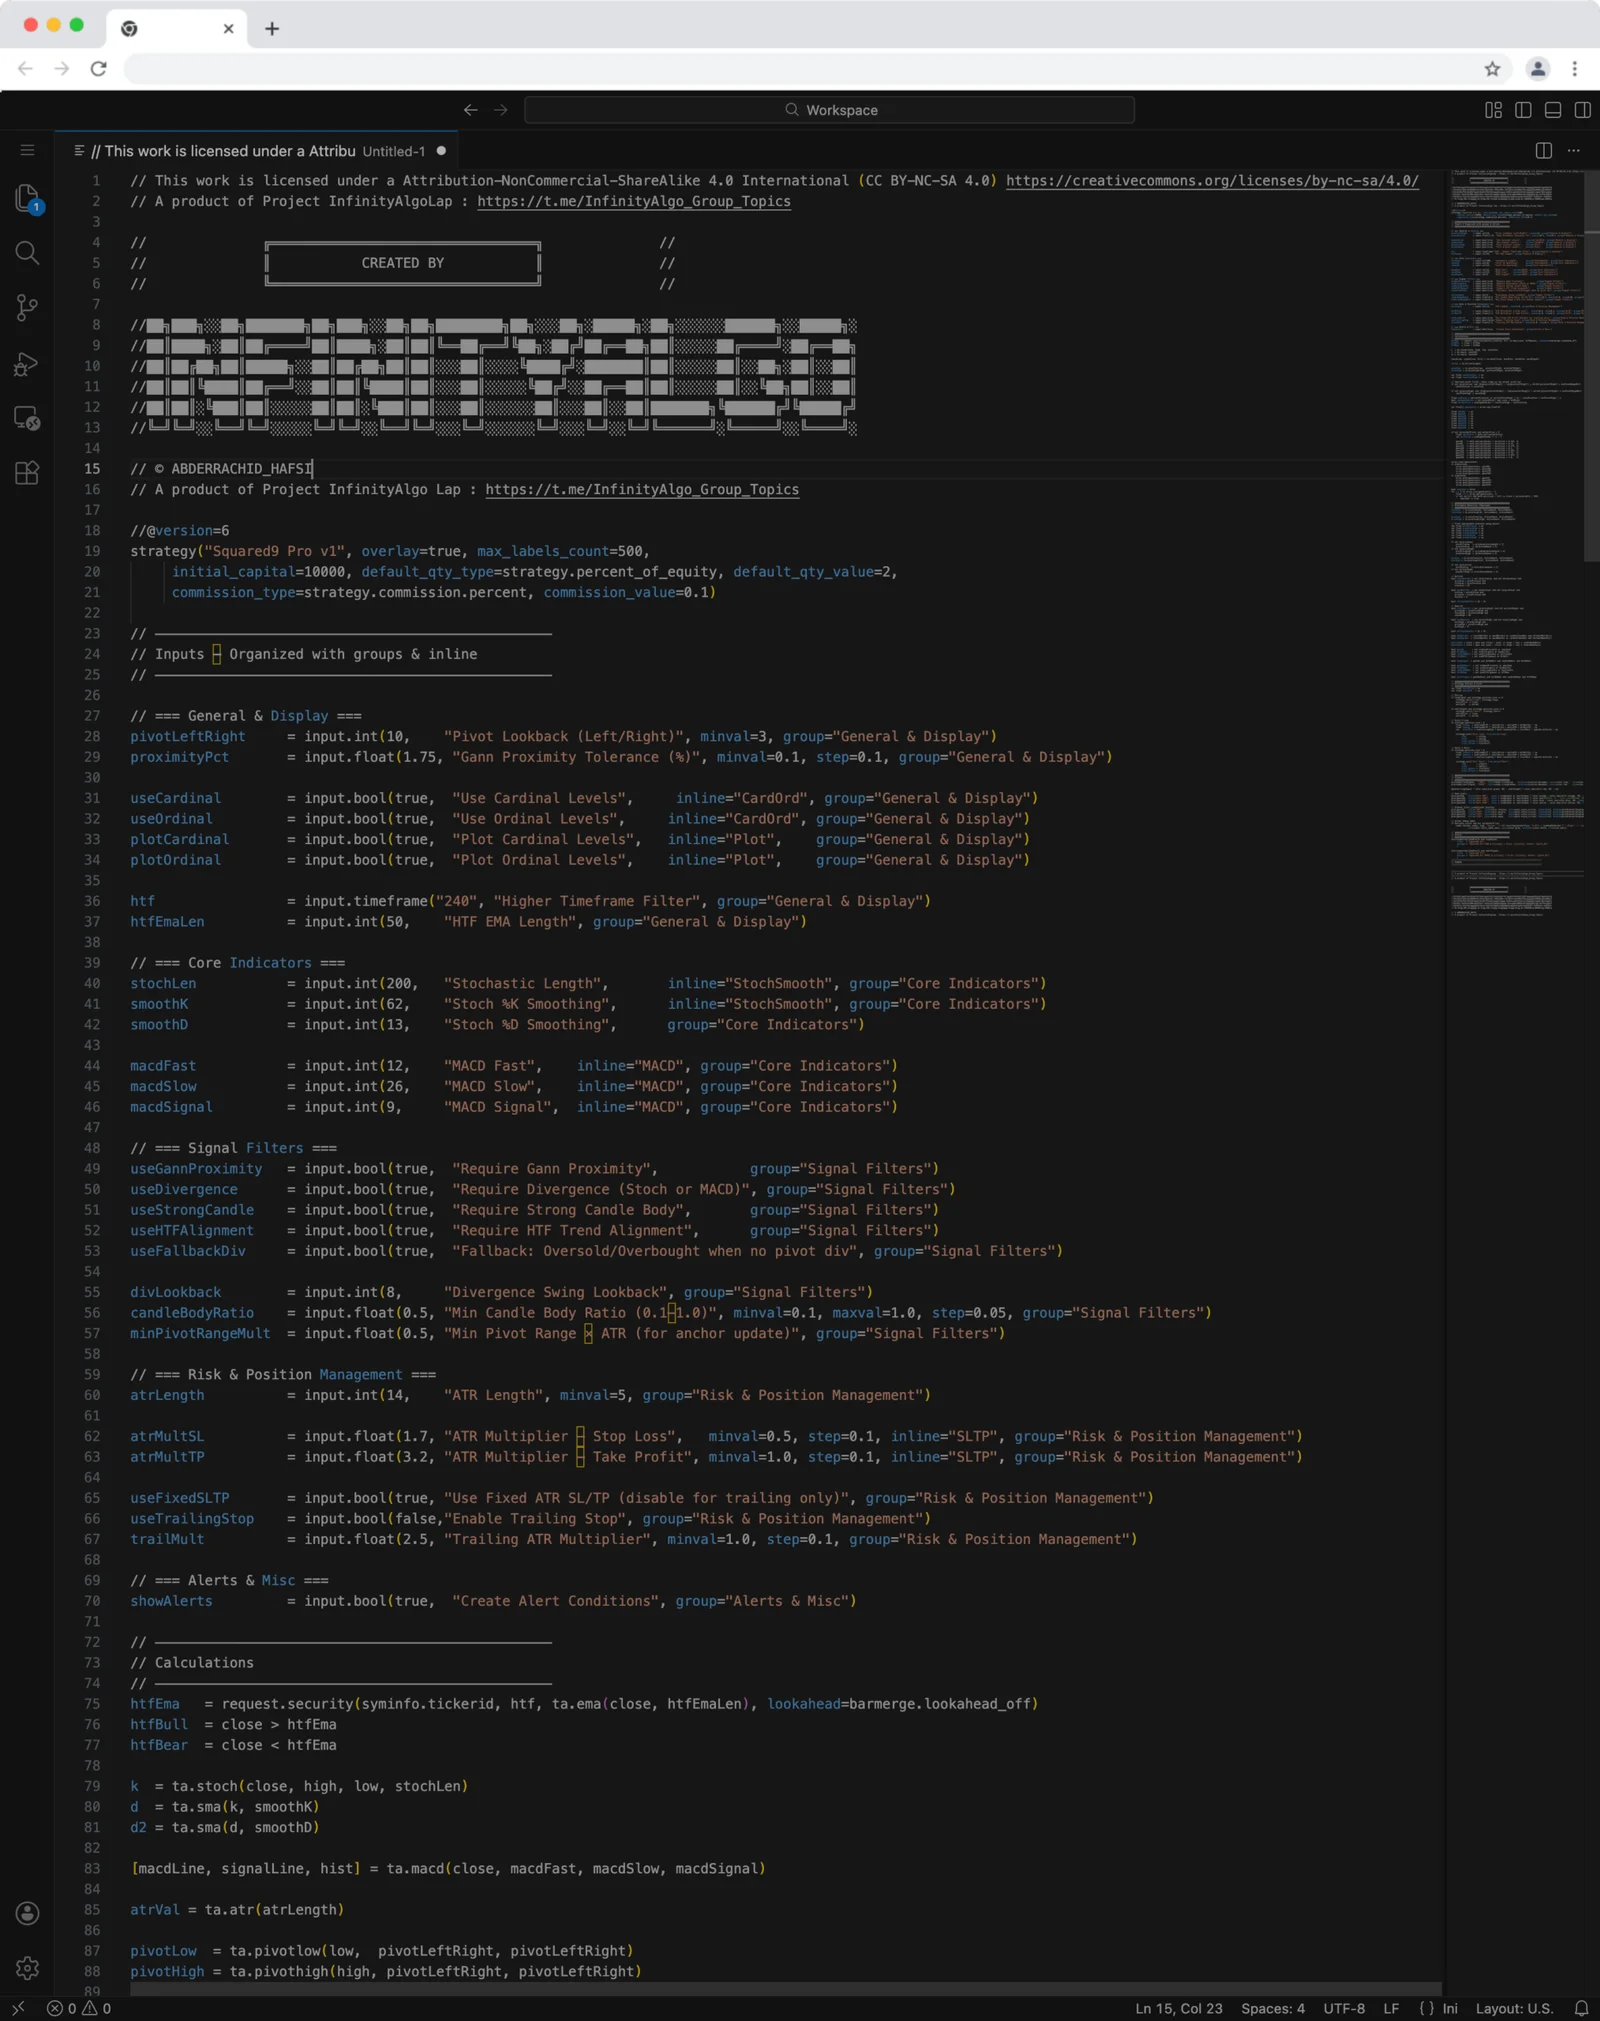
Squared9 Pro v1 Tradingview Free Download - PineScript
Squared9 Pro v1.0 (strategy) combines classic Gann geometry with modern momentum checks to find high-conviction reversal zones.
![Impulse Trend Levels [InfinityAlgo]](https://infinityalgoacademy.net/wp-content/uploads/2026/02/Impulse-Trend-Levels-BOSWaves-—-Indicator-by-BOSWaves-—-TradingView-19-02-2026_19_05-scaled.png)
Impulse Trend Levels [InfinityAlgo]
Impulse Trend Levels [InfinityAlgo] is a momentum-aware trend identification system that tracks directional price movement through adaptive confidence bands, where band width dynamically adjusts based on impulse strength and freshness to reflect real-time conviction in the current trend direction.