
SMT Double Div TradingFinder Indicator in NinjaTrader – Free
The SMT Double Div TradingFinder Indicator by TradingFinder is built on the simultaneous analysis of price behavior across two correlated markets and focuses on structural discrepancies between highs and lows.
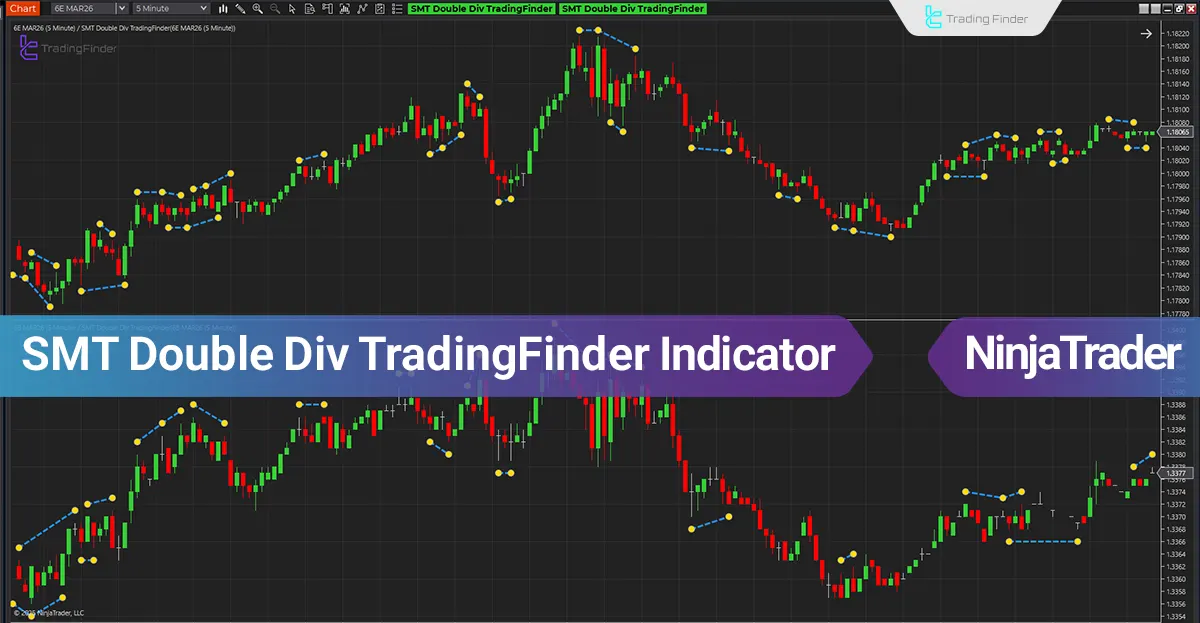
SMT Double Div TradingFinder Indicator at a Glance
Signals generated by the Smart Money Double Divergence Indicator by TradingFinder are displayed on the chart as connected lines between key price points.
This visual structure keeps the analyst’s focus directly on real price behavior and market structure logic and ties the decision making process to accurate analysis and reading of liquidity flow.
In this trading tool, circles act as markers of valid high and low pivots and form the basis for analyzing behavioral discrepancies between two correlated markets.
Additionally, the dashed line between these circles clearly illustrates the inability of one market to confirm a new high or low.
This visual combination makes the formation of Smart Money divergence identifiable without introducing additional noise, as follows:
- Connecting simultaneous pivots in two markets
- Displaying divergence through clearly defined colored line
- Precise differentiation between regular divergence and double divergence
- Ability to filter signals through indicator setting
Indicator in an Uptrend
According to the image below, a bullish scenario based on Smart Money Double Divergence becomes active when the upper market records a lower low while the lower market fails to confirm a new low within the same time window.
The low pivot circles and the bullish dashed line display the behavioral discrepancy between the two correlated markets and reveal weakness in institutional selling pressure.
The alignment of this divergence with liquidity grabs below previous lows and price entry into the discount zone increases the validity of the bullish scenario.
Following this structure, continuation of price movement in the reference market signals the beginning of an accumulation phase and creates conditions for the formation of a controlled bullish leg.
Related Products

Dual Structural Trendline Fib Channel Free Download
Dual Structural Trendline Fib Channel is a structural analysis indicator that automatically constructs dual trendline channels using pivot-based slope logic.
![Wedge Pattern [InfinityAlgo] Free Download](https://infinityalgoacademy.net/wp-content/uploads/2026/02/Wedge-Pattern-UAlgo-—-Indicator-by-UAlgo-—-TradingView-22-02-2026_21_34-scaled.png)
Wedge Pattern [InfinityAlgo] Free Download
Wedge Pattern is a chart overlay that detects rising and falling wedge formations using strict pivot based rules and a validation engine that enforces classic technical analysis requirements. The script builds two trendlines from confirmed pivot highs and pivot lows

Volatility Aggregation Model Tradingview
Volatility Aggregation Model (VAM) is a very simple overlay indicator that classifies market direction using a five-speed ensemble of volatility-adaptive range engines. Instead of relying on a single trend filter, VAM evaluates direction across multiple responsiveness settings and converts those states into a normalized score
Quantum Emperor MT4 Free Download
Introducing Quantum Emperor EA, the groundbreaking MQL5 expert advisor that's transforming the way you trade the prestigious GBPUSD pair! Developed by a team of experienced traders with trading experience of over 13 years.
CyNera MT4 Free Download
Trading gold, one of the most volatile instruments in the market, demands precision, in-depth analysis, and strong risk management. CyNera Expert Advisor seamlessly integrates these elements into a sophisticated system designed for optimal gold trading.