
![Money Flow Profile [LuxAlgo]](https://infinityalgoacademy.net/wp-content/uploads/2026/02/Money-Flow-Profile-LuxAlgo.png)
Money Flow Profile [LuxAlgo]
The Money Flow Profile is a charting tool that measures the traded volume or the money flow at all price levels on the market over a specified time period and highlights the relationship between the price of a given asset and the willingness of traders to either buy or sell it
This tool combines a volume/money flow profile, a sentiment profile, and price levels, where the right side of the profile highlights the distribution of the traded activity/money flow at different price levels, the left side of the profile highlights the market sentiment at those price levels, and in the middle the price levels.
🔶 USAGE
A volume/money flow profile is an advanced charting tool that displays the traded volume/money flow at different price levels over a specific period. It helps traders visualize where the majority of trading activity/money flow has occurred.
A sentiment profile is a difference between buy and sell volume/money flow aiming to highlight the sentiment/dominance at specific price levels.
Each row of the profile presents figures on volume and money flow specific to price levels.
High volume/money flow nodes indicate areas of high activity and are likely to act as support or resistance in the future. They attract price and try to hold it there. Conversely, low-volume nodes are areas with low trading activity, that are less subject to get revisited by the price. The market often bounces right over these levels, not staying for long. The “Profile Heatmap” option of the script helps to better emphasize the trading activity within each areas.
By measuring the traded activity at each price level the script presents an ability to highlight the consolidation zones, in other words, highlights accumulation and distribution zones. When the price moves toward one end of the consolidation and volume pick up, it can foreshadow a potential breakout.
Level of Significance, Point of Control, Highest Sentiment Zone, and Profile Price levels are some of the other profile-related options available with the script.
🔶 SETTINGS
The script takes into account user-defined parameters and plots the profiles, where detailed usage for each user-defined input parameter in indicator settings is provided with the related input’s tooltip.
🔹 Profile Generic Settings
- Lookback Length / Fixed Range: Sets the lookback length.
- Profile Source: Sets the profile source, Volume, or Money Flow.
🔹 Profile Presentation Settings
- Volume/Money Flow Profile: Toggles the visibility of the Volume/Money Flow Profile.
- High Traded Nodes: Threshold and Color option for high traded nodes.
- Average Traded Nodes: Color option for average traded nodes.
- Low Traded Nodes: Threshold and Color option for low traded nodes.
🔹 Sentiment Profile Settings
- Sentiment Profile: Toggles the visibility of the Sentiment Profile.
- Sentiment Polarity Method: Sets the method used to calculate the up/down volume/money flow.
- Bullish Nodes: Color option for Bullish Nodes.
- Bearish Nodes: Color option for Bearish Nodes.
🔹 Profile Heatmap Settings
- Profile Heatmap: Toggles the visibility of the profile heatmap.
- Heatmap Source: Sets the source of the profile heatmap, Volume/Money Flow Profile, or Sentiment Profile.
- Heatmap Transparency: Control the transparency of the profile heatmap.
🔹 Other Presentation Settings
- Level of Significance: Toggles the visibility of the level of significance line/zone.
- Consolidation Zones: Toggles the visibility of the consolidation zones.
- Consolidation Threshold, Color: Sets the threshold value and zone color.
- Highest Sentiment Zone: Toggles the visibility of the highest bullish or bearish sentiment zone.
- Profile Price Levels, Color, Size: Toggles the visibility of the profile price levels, and sets the color and the size of the level labels.
- Profile Range Background Fill: Toggles the visibility of the profiles range.
🔹 Other Settings
- Number of Rows: Specify how many rows each profile histogram will have.
- Profile Width %: Alters the width of the rows in the histogram, relative to the profile length
- Profile Text Size: Alters the size of the text. Setting to Auto will keep the text within the box limits.
- Profile Horizontal Offset: Enables to move profile in the horizontal axis.
🔶 RELATED SCRIPTS
Liquidity-Sentiment-Profile
Swing-Volume-Profiles
For more and other conceptual scripts you are kindly invited to visit LuxAlgo-Scripts.
– Set “Auto” text size to default
– Fixed loop timeouts when using maximum amount for the lookback/rows settings
– Fixed profile price levels being too small
– Minor changes
Related Products

Dual Structural Trendline Fib Channel Free Download
Dual Structural Trendline Fib Channel is a structural analysis indicator that automatically constructs dual trendline channels using pivot-based slope logic.
![Wedge Pattern [InfinityAlgo] Free Download](https://infinityalgoacademy.net/wp-content/uploads/2026/02/Wedge-Pattern-UAlgo-—-Indicator-by-UAlgo-—-TradingView-22-02-2026_21_34-scaled.png)
Wedge Pattern [InfinityAlgo] Free Download
Wedge Pattern is a chart overlay that detects rising and falling wedge formations using strict pivot based rules and a validation engine that enforces classic technical analysis requirements. The script builds two trendlines from confirmed pivot highs and pivot lows

Volatility Aggregation Model Tradingview
Volatility Aggregation Model (VAM) is a very simple overlay indicator that classifies market direction using a five-speed ensemble of volatility-adaptive range engines. Instead of relying on a single trend filter, VAM evaluates direction across multiple responsiveness settings and converts those states into a normalized score
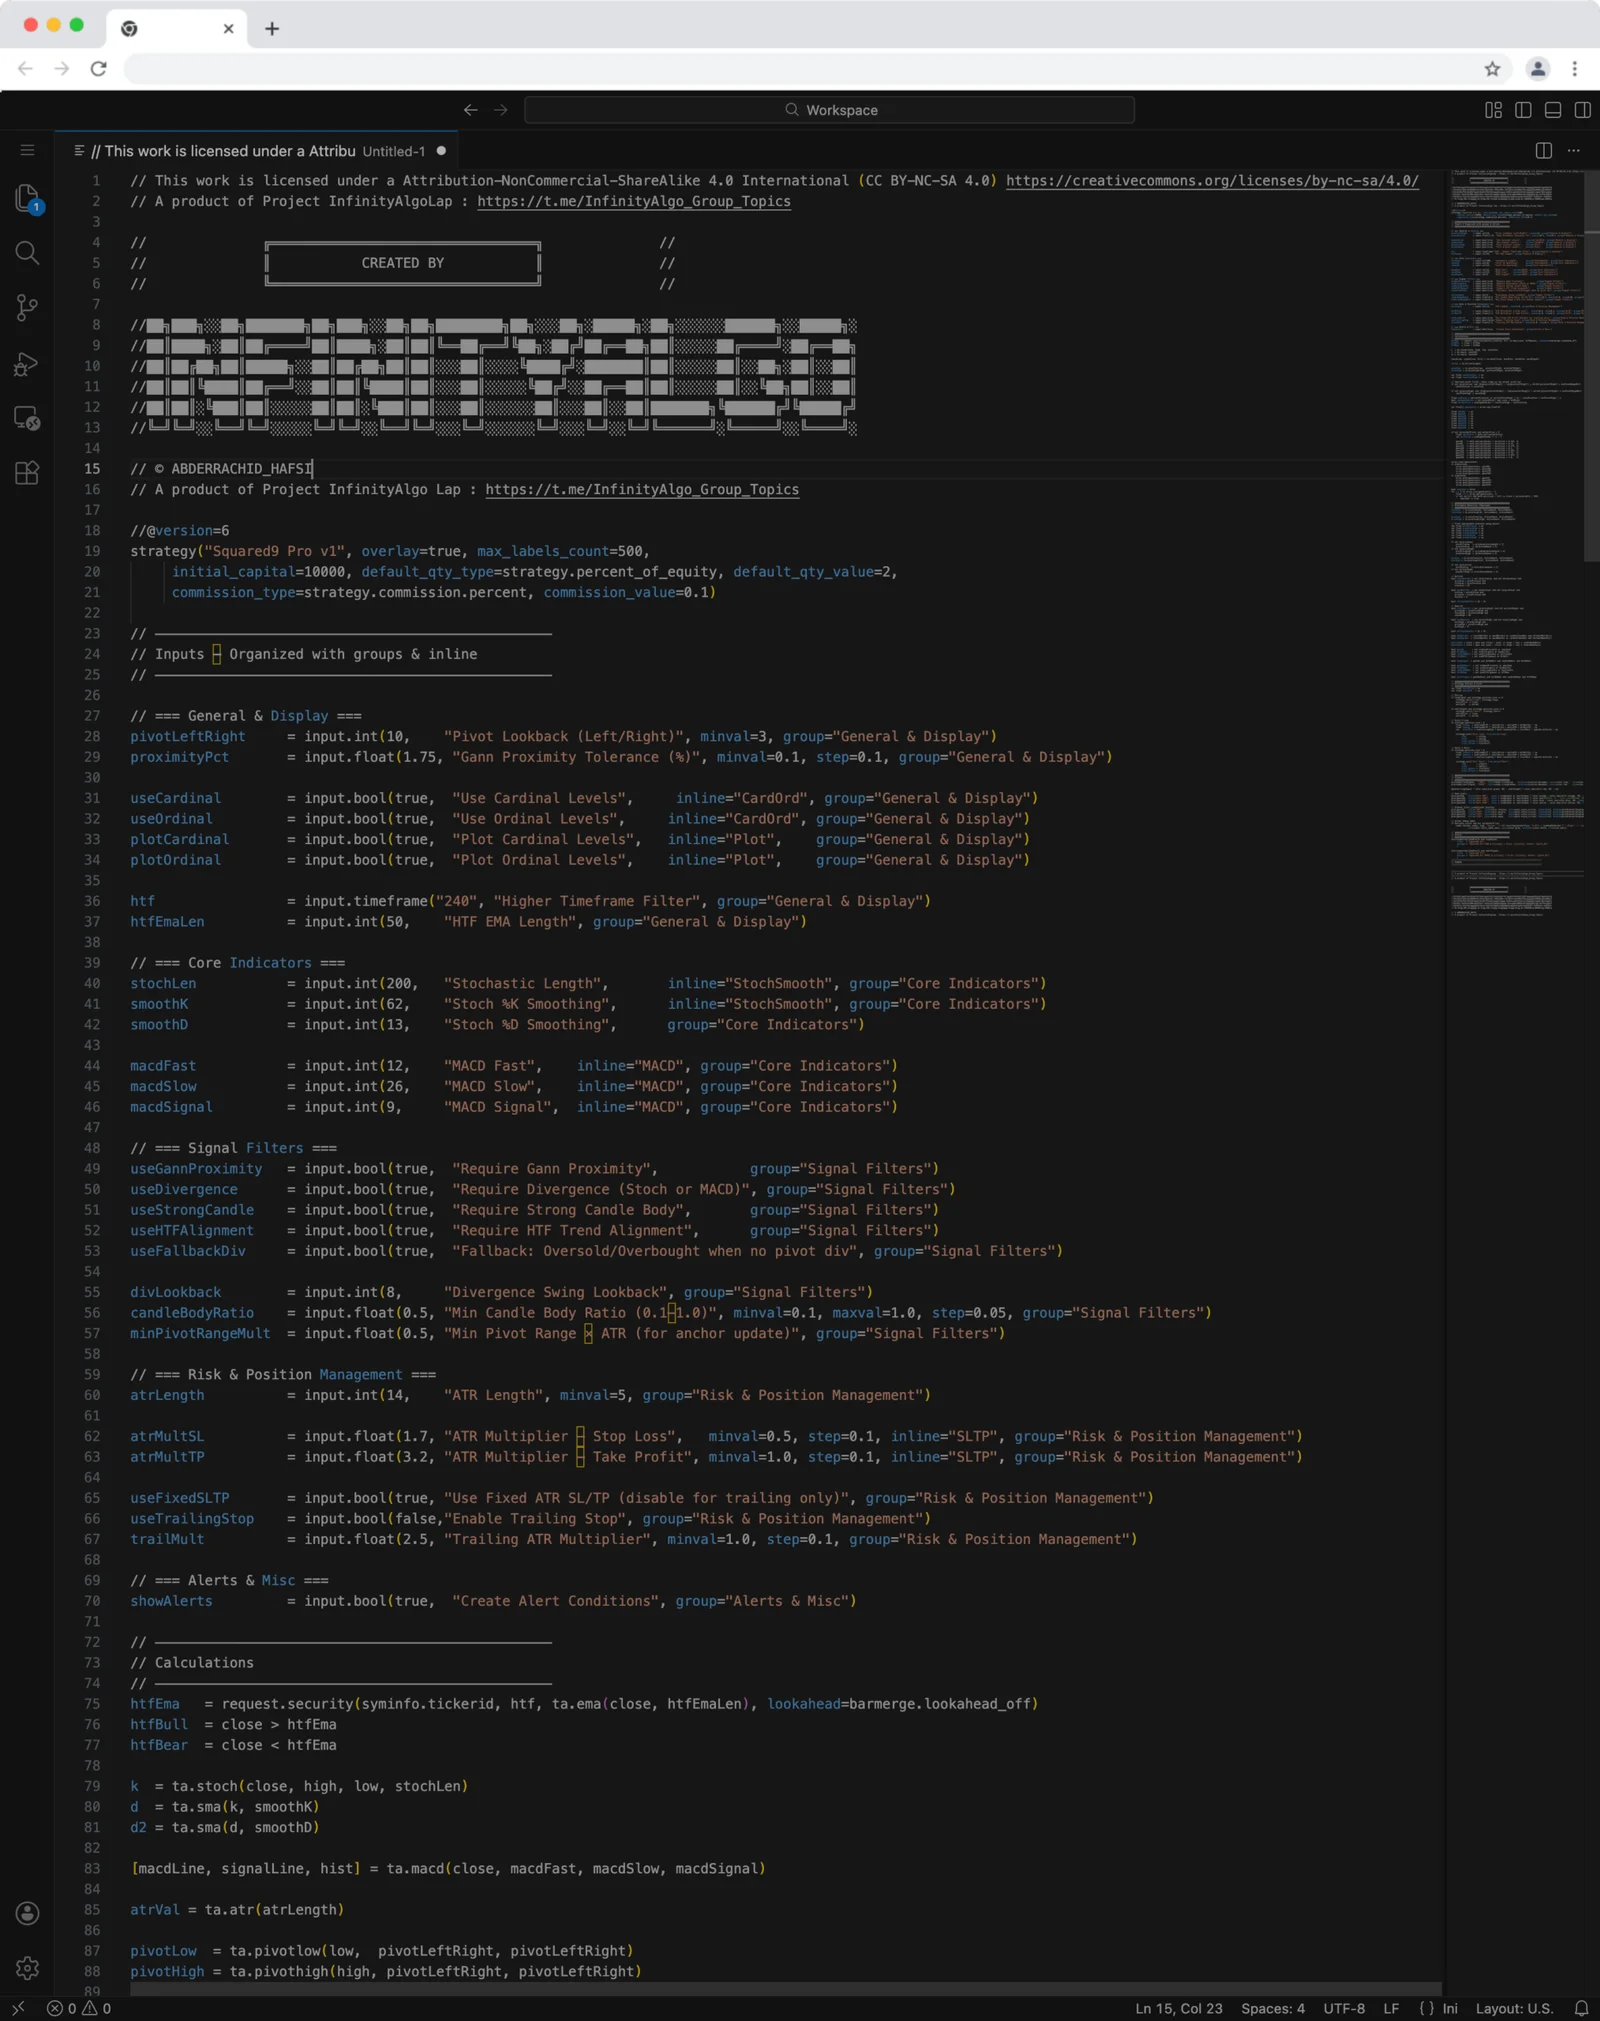
Squared9 Pro v1 Tradingview Free Download - PineScript
Squared9 Pro v1.0 (strategy) combines classic Gann geometry with modern momentum checks to find high-conviction reversal zones.
![Impulse Trend Levels [InfinityAlgo]](https://infinityalgoacademy.net/wp-content/uploads/2026/02/Impulse-Trend-Levels-BOSWaves-—-Indicator-by-BOSWaves-—-TradingView-19-02-2026_19_05-scaled.png)
Impulse Trend Levels [InfinityAlgo]
Impulse Trend Levels [InfinityAlgo] is a momentum-aware trend identification system that tracks directional price movement through adaptive confidence bands, where band width dynamically adjusts based on impulse strength and freshness to reflect real-time conviction in the current trend direction.