
![Free Download - ICT Silver Bullet [LuxAlgo]](https://infinityalgoacademy.net/wp-content/uploads/2026/02/ICT-Silver-Bullet-LuxAlgo-.png)
Free Download - ICT Silver Bullet [LuxAlgo]
The ICT Silver Bullet indicator is inspired from the lectures of "The Inner Circle Trader" (ICT) and highlights the Silver Bullet (SB) window which is a specific 1-hour interval where a Fair Value Gap (FVG) pattern can be formed.
When a FVG is formed during the Silver Bullet window, Support & Resistance lines will be drawn at the end of the SB session.
There are 3 different Silver Bullet windows (New York local time):
- The London Open Silver Bullet (3 AM — 4 AM ~ 03:00 — 04:00)
- The AM Session Silver Bullet (10 AM — 11 AM ~ 10:00 — 11:00)
- The PM Session Silver Bullet (2 PM — 3 PM ~ 14:00 — 15:00)
🔶 USAGE
The ICT Silver Bullet indicator aims to provide users a comprehensive display as similar as possible to how anyone would manually draw the concept on their charts.
It’s important to use anything below the 15-minute timeframe to ensure proper setups can display. In this section, we are purely using the 3-minute timeframe.
In the image below, we can see a bullish setup whereas a FVG was successfully retested during the Silver Bullet session. This was then followed by a move upwards to liquidity as our target.
Alternatively, you can also see below a bearish setup utilizing the ICT Silver Bullet indicator outlined.
At this moment, the indicator has removed all other FVGs within the Silver Bullet session & has confirmed this FVG as the retested one.
There is also a support level marked below to be used as a liquidity target as per the ICT Silver Bullet concept suggests.
In the below chart we can see 4 separate consecutive examples of bullish & bearish setups on the 3-minute chart.
🔶 CONCEPTS
This technique can visualize potential support/resistance lines, which can be used as targets.
The script contains 2 main components:
• forming of a Fair Value Gap (FVG)
• drawing support/resistance (S/R) lines
🔹 Forming of FVG
1 basic principle: when a FVG at the end of the SB session is not retraced, it will be made invisible.Dependable on the settings, different FVG’s will be shown.
• ‘All FVG’: all FVG’s are shown, regardless the trend• ‘Only FVG’s in the same direction of trend’: Only FVG’s are shown that are similar to the trend at that moment (trend can be visualized by enabling ‘Show‘ -> ‘Trend‘)
-> only bearish FVG when the trend is bearish vs. bullish FVG when trend is bullish• ‘strict’: Besides being similar to the trend, only FVG’s are shown when the closing price at the end of the SB session is:
– below the top of the FVG box (bearish FVG)
– above bottom of the FVG box (bullish FVG)• ‘super-strict’: Besides being similar to the trend, only FVG’s are shown when the FVG box is NOT broken
in the opposite direction AND the closing price at the end of the SB session is:
– below bottom of the FVG box (bearish FVG)
– above the top of the FVG box (bullish FVG)‘Super-Strict‘ mode resembles ICT lectures the most.
🔹 Drawing support/resistance lines
When the SB session has ended, the script draws potential support/resistance lines, again, dependable on the settings.
• Previous session (any): S/R lines are fetched between current and previous session.
For example, when current session is ‘AM SB Session (10 AM — 11 AM)‘, then previous session is
‘London Open SB (3 AM — 4 AM)‘, S/R lines between these 2 sessions alone will be included.• Previous session (similar): S/R lines are fetched between current and previous – similar – session.
For example, when current session is ‘London Open SB (3 AM — 4 AM)’, only S/R lines between
current session and previous ‘London Open SB (3 AM — 4 AM)‘ session are included.When a new session starts, S/R lines will be removed, except when enabling ‘Keep lines (only in [super-]strict mode)‘
This is not possible in ‘All FVG‘ or ‘Only FVG’s in the same direction of trend‘ mode, since the chart would be cluttered.
Note that in ‘All FVG‘ or ‘Only FVG’s in the same direction of trend‘ mode, both, Support/Resistance lines will be shown,
while in Strict/Super-Strict mode:
• only Support lines will be shown if a bearish FVG appears
• only Resistance lines if a bullish FVG is shown
The lines will still be drawn the the end of the SB session, when a valid FVG appears,
but the S/R lines will remain visible and keep being updated until price reaches that line.
This publication contains a “Minimum Trade Framework (mTFW)”, which represents the best-case expected price delivery, this is not your actual trade entry – exit range.
• 40 ticks for index futures or indices
• 15 pips for Forex pairs.
When on ‘Strict/Super-Strict‘ mode, only S/R lines will be shown which are:
• higher than the lowest FVG bottom + mTFW, in a bullish scenario
• lower than the highest FVG bottom – mTFW, in a bearish scenario
When on ‘All FVG/Only FVG’s in the same direction of trend‘ mode, or on non-Forex/Futures/Indices symbols, S/R needs to be higher/lower than SB session high/low.
🔶 SETTINGS
(Check CONCEPTS for deeper insights and explanation)
🔹 Swing settings (left): Sets the length, which will set the lookback period/sensitivity of the Zigzag patterns (which directs the trend)
🔹 Silver Bullet Session; Show SB session: show lines and labels of SB session
Labels can be disabled separately in the ‘Style‘ section, color is set at the ‘Inputs‘ section.
🔹 FVG
– Mode
• All FVG
• Only FVG’s in the same direction of trend
• Strict
• Super-Strict
– Colors
– Extend: extend till last bar of SB session
🔹 Targets – support/resistance lines
– Previous session (any): S/R lines fetched between current and previous SB session
– Previous session (similar): S/R lines fetched between current and previous similar SB session
– Colors
– Keep lines (only in [super-]strict mode)
🔹 Show
– MSS ~ Session: Show Market Structure Shift, only when this happens during a SB session
– Trend: Show trend (Zigzag, colored ~ trend)
Updated boxes to fix visual on FVGs
Minor changes
Related Products

Dual Structural Trendline Fib Channel Free Download
Dual Structural Trendline Fib Channel is a structural analysis indicator that automatically constructs dual trendline channels using pivot-based slope logic.
![Wedge Pattern [InfinityAlgo] Free Download](https://infinityalgoacademy.net/wp-content/uploads/2026/02/Wedge-Pattern-UAlgo-—-Indicator-by-UAlgo-—-TradingView-22-02-2026_21_34-scaled.png)
Wedge Pattern [InfinityAlgo] Free Download
Wedge Pattern is a chart overlay that detects rising and falling wedge formations using strict pivot based rules and a validation engine that enforces classic technical analysis requirements. The script builds two trendlines from confirmed pivot highs and pivot lows

Volatility Aggregation Model Tradingview
Volatility Aggregation Model (VAM) is a very simple overlay indicator that classifies market direction using a five-speed ensemble of volatility-adaptive range engines. Instead of relying on a single trend filter, VAM evaluates direction across multiple responsiveness settings and converts those states into a normalized score
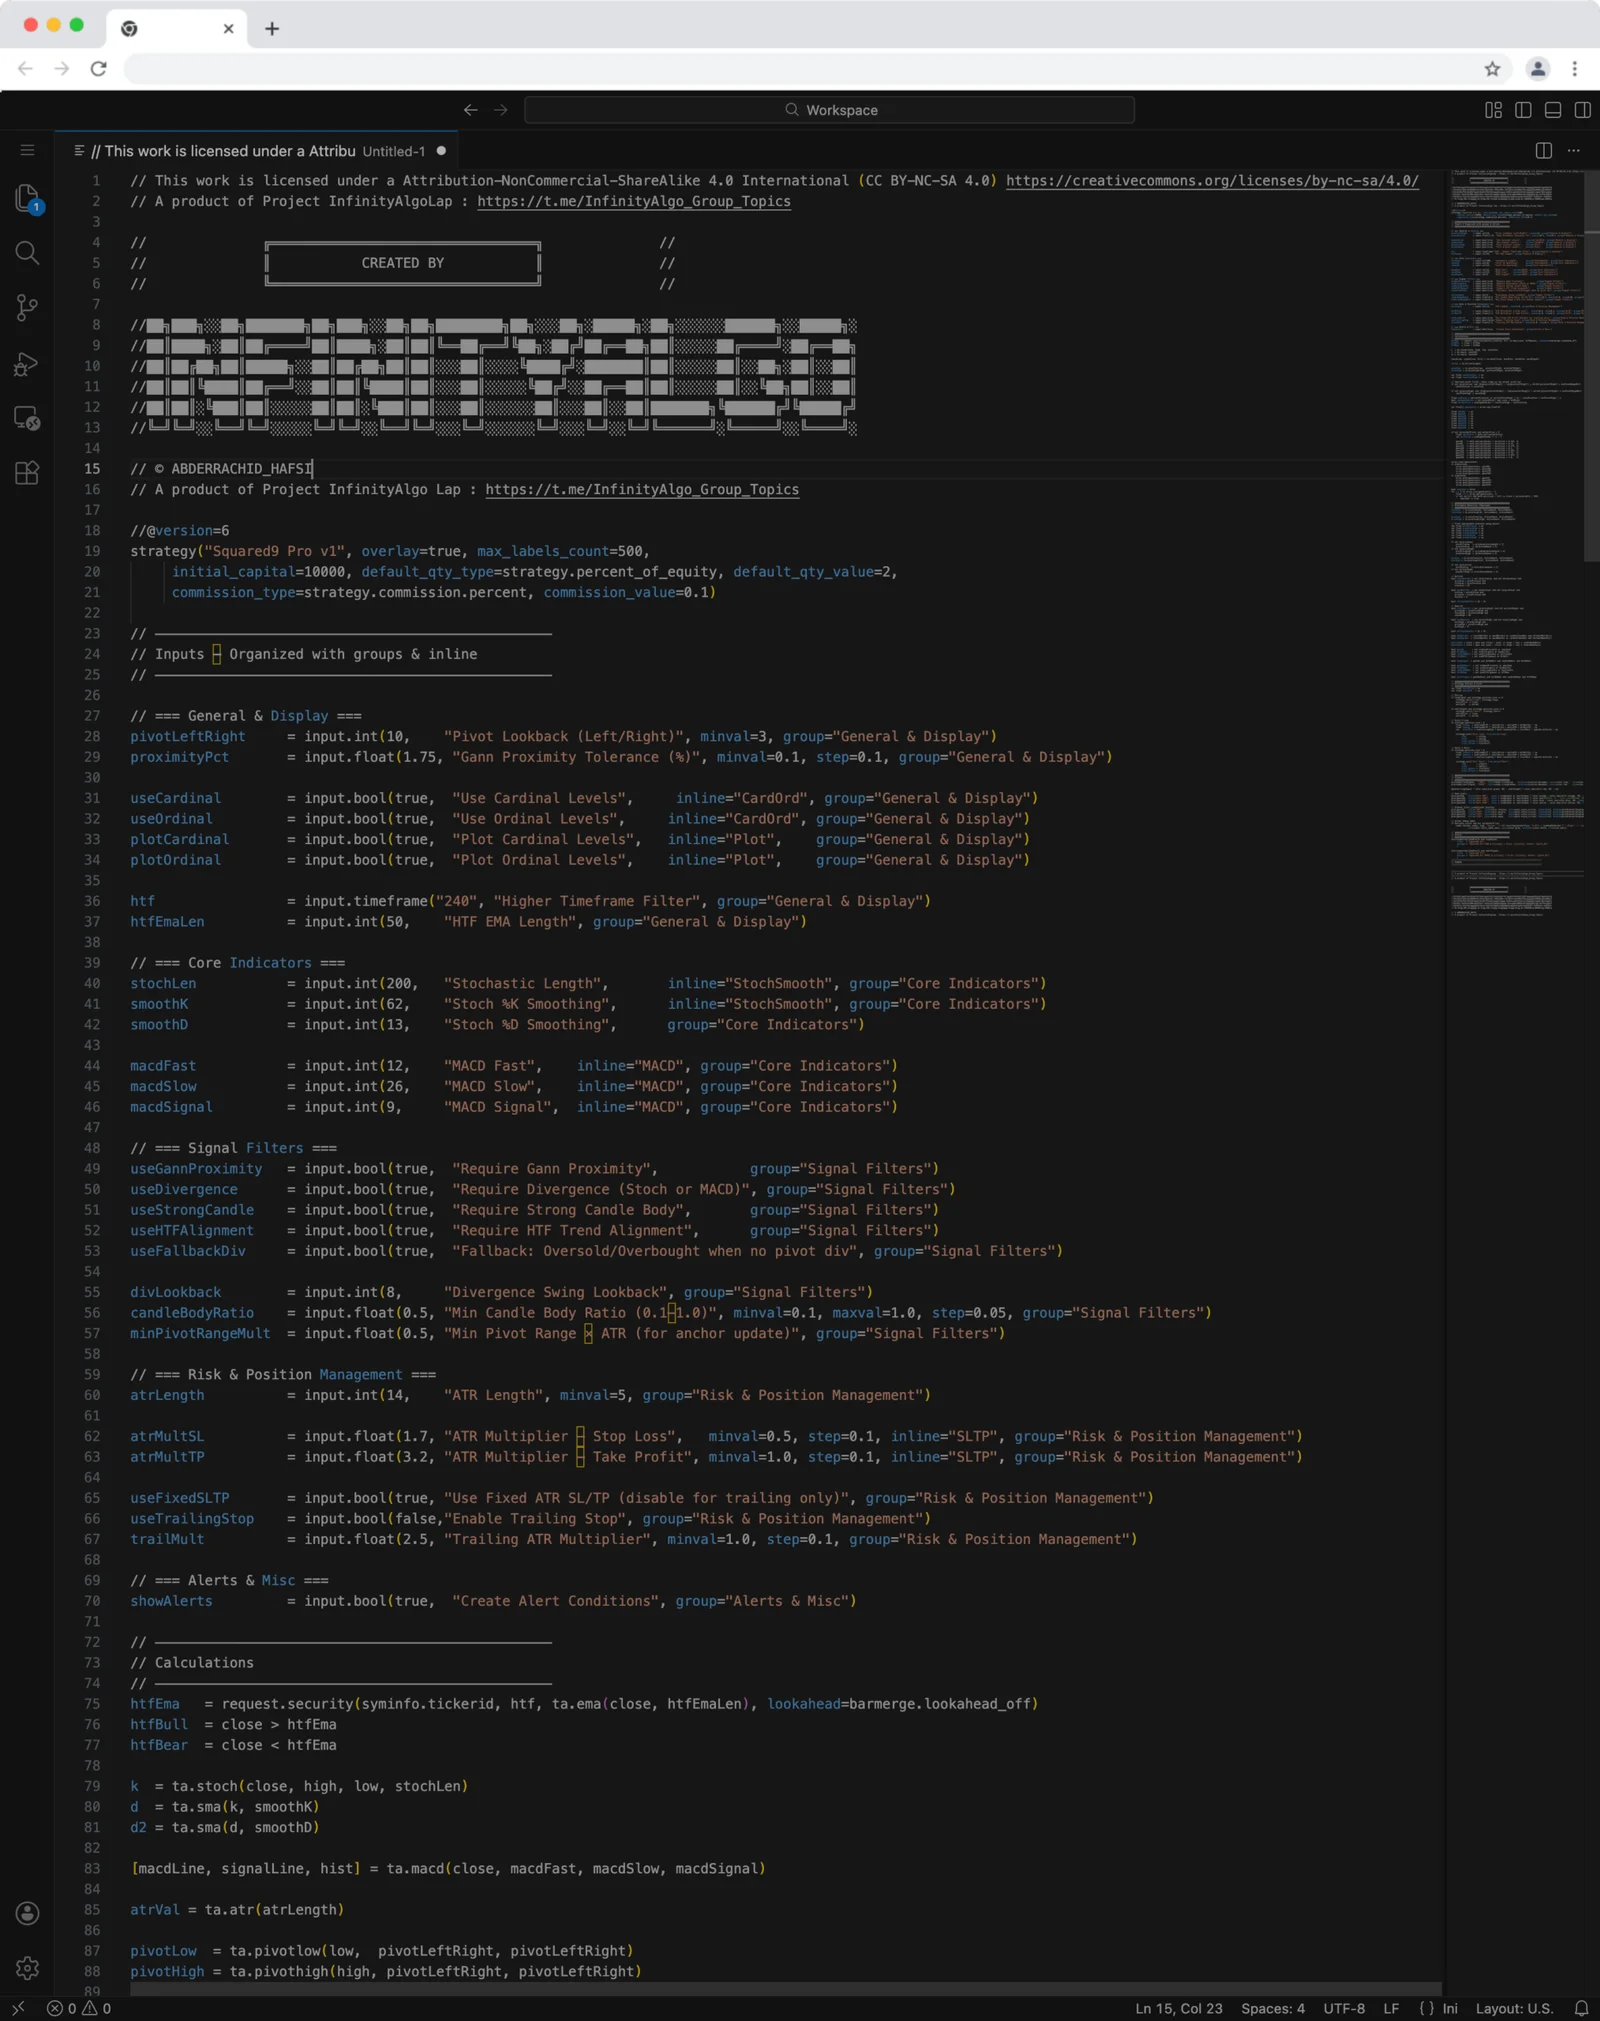
Squared9 Pro v1 Tradingview Free Download - PineScript
Squared9 Pro v1.0 (strategy) combines classic Gann geometry with modern momentum checks to find high-conviction reversal zones.
![Impulse Trend Levels [InfinityAlgo]](https://infinityalgoacademy.net/wp-content/uploads/2026/02/Impulse-Trend-Levels-BOSWaves-—-Indicator-by-BOSWaves-—-TradingView-19-02-2026_19_05-scaled.png)
Impulse Trend Levels [InfinityAlgo]
Impulse Trend Levels [InfinityAlgo] is a momentum-aware trend identification system that tracks directional price movement through adaptive confidence bands, where band width dynamically adjusts based on impulse strength and freshness to reflect real-time conviction in the current trend direction.