
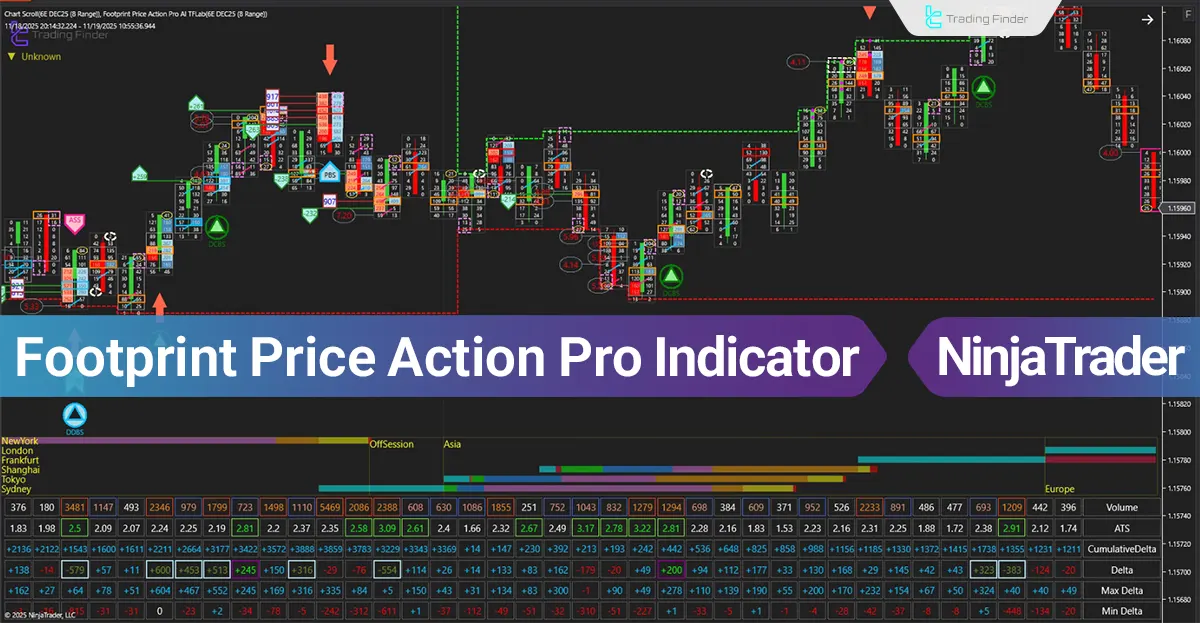
Footprint Price Action Pro Indicator in NinjaTrader
The Footprint Price Action Pro indicator is a tool for studying market microstructure within the NinjaTrader platform.
Footprint Price Action Pro Indicator at a Glance The processing engine of the Footprint Price Action Pro indicator breaks down traded volume at each tick and reveals the combined strength of buyers and sellers as printed structure on the chart.
The main process of the tool works as follows:
Separating executed volume on the Bid and Ask sides and displaying it as distinct numbers in each price block Evaluating volume “Imbalances” to identify zones where aggressive buyers or sellers enter the market Calculating Delta and Cumulative Delta to observe shifts in order flow during bullish or bearish trends Detecting behaviors such as Volume Climax, Absorption, Exhaustion, and Stopping Volume Displaying volume structure in areas with liquidity reactions and market directional changes This collection of data creates a precise framework for understanding smart-money behavior in real time and clearly illustrates the path of order flow within each candle’s structure.
Analytical Applications of the Footprint Price Action Pro Indicator in Market Analysis
The application of the Footprint Price Action Pro indicator is based on deep study of volume behavior and order flow, and it holds structural importance for Order Flow traders.
The most important applications are:
- Determining the validity of breakouts at support and resistance zones based on continuous imbalances within price blocks
- Analyzing volume reactions at key levels such as Order Blocks, Fair Value Gaps, and liquidity zones
- Evaluating the entry or exit of large players through absorption patterns or delta changes
- Identifying weakness or strength in price swings when examining Volume Tails at candle highs or lows
- Reconstructing real market behavior during fake breakouts, rejections, and reversal scenarios
This trading tool shifts professional decision-making from a raw-price model to a model based on actual executed volume and order flow data.
Indicator During a Bullish Trend
In the Price Action Pro Footprint Order Volume indicator, buy signals are generated based on the combination of several factors:
- A demand zone or dynamic support zone highlighted in green
- Delta flipping positive along with increased delta-change velocity
- Stair-step growth in Cumulative Delta, breaking previous delta highs, while price is located in a pullback zone
- Clustered buy-side imbalances across multiple price levels near the lows and Ask dominance over Bid
- Sell-side absorption at the low and formation of a Volume Tail on the lower section of the confirmation candle
- Printing of the “DCBS” icon as the final algorithm output directly on the structural low
In the image below, the buy signal is triggered when aggressive buying pressure at the Ask, positive delta rotation, rising cumulative delta, and seller absorption near the low occur simultaneously.
Then, price stabilization within the green zone shows that the low is preserved and buyer entry is structurally confirmed.
Footprint Price Action Pro Indicator Settings The following image shows the settings panel of the Trade Volume Indicator on the NinjaTrader platform:
Detailed review of the Trading Volume Indicator settings panel on the NinjaTrader platform General: Core Configuration SessionsGrid: Trading Session Grid Layout Left Side: Left-Panel Parameters Right Side: Right-Panel Parameters Volume Profile: Executed Volume Profile Cumulative Delta: Aggregated Delta Imbalance: Volume Imbalance Modules Big Volume: High-Volume Prints Big Delta: High-Delta Signals Big Contract: Large-Contract Executions Big ATS: Large Average Trade Size Volume Marker: Volume Highlight Marker Delta Marker: Delta Highlight Marker Contract Marker: Contract Highlight Marker ATS Marker: ATS Highlight Marker Delta Divergence: Delta Divergence Detector Fishing: Liquidity Sweep Detection Large Print: Block Trade Single Print: Single-Tick Print Ratio Bar: Ratio-Analytics Bar Spread Bar: Bid-Ask Spread Bar Absorption Area: Absorption Detection Zone Bar Report: Bar-Level Report Table Report: Table-Formatted Report Session High/Low: Session Extremes Text: Text Formatting Menu: Indicator Menu Data Series: Data Series Configuration Setup: Initialization Settings Visual: Visual Appearance Options Note: In the “General” section, three independent filter-application modes are available, and the user can activate each based on analytical logic:
AI Automatic Manual
Related Products
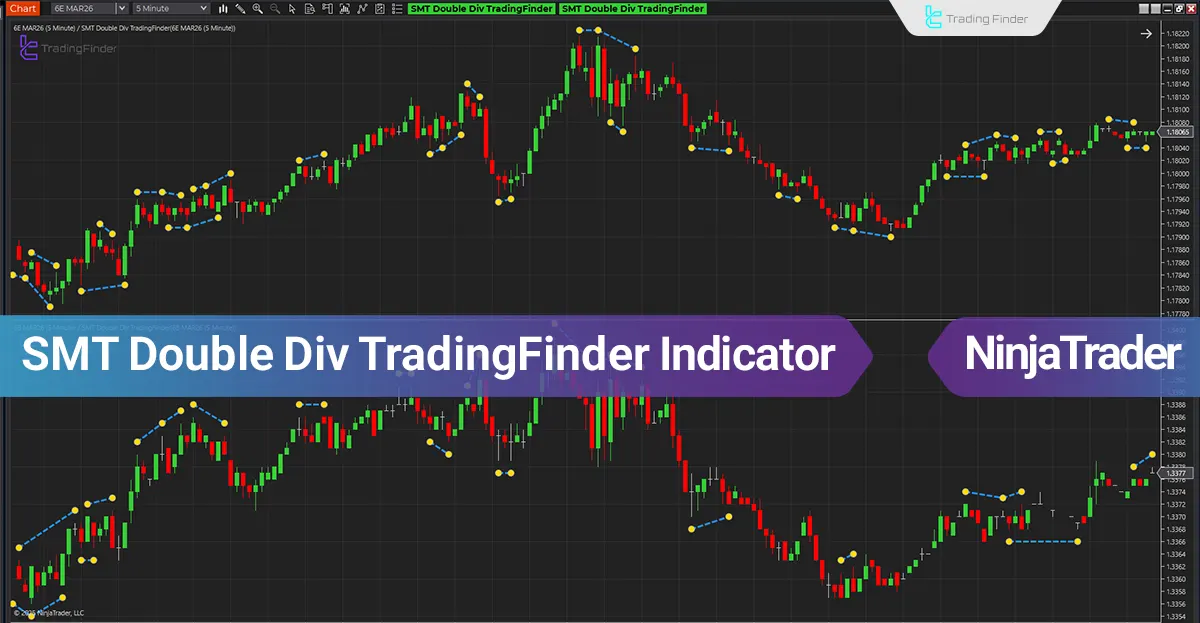
SMT Double Div TradingFinder Indicator in NinjaTrader – Free
The SMT Double Div TradingFinder Indicator by TradingFinder is built on the simultaneous analysis of price behavior across two correlated markets and focuses on structural discrepancies between highs and lows.
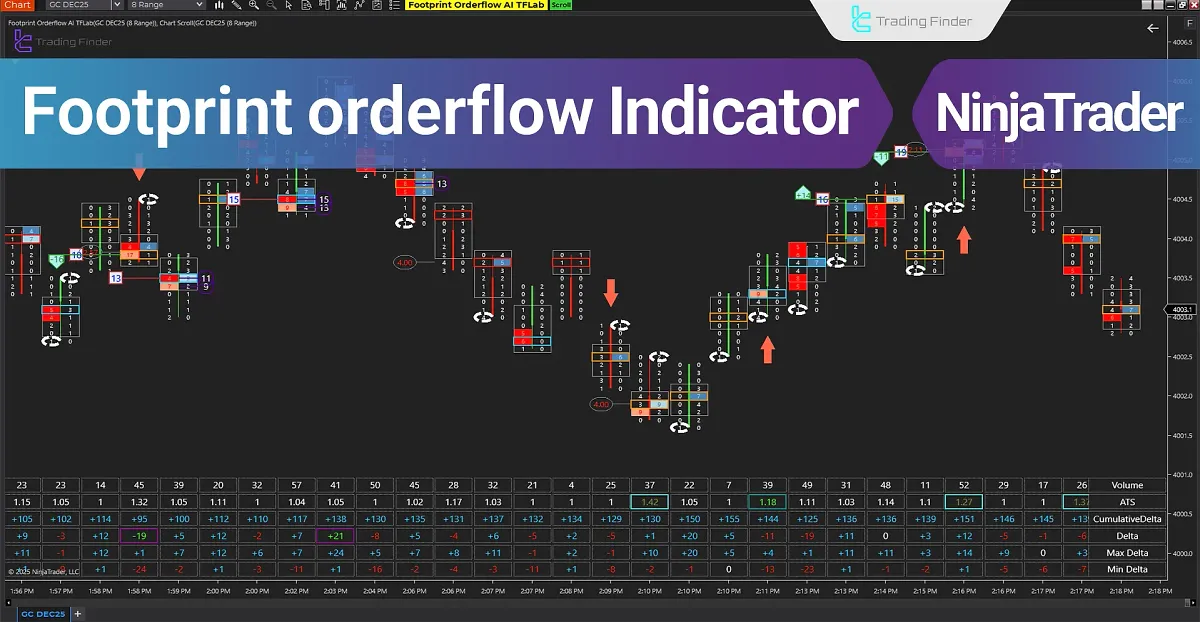
Footprint Orderflow Indicator in NinjaTrader
The Footprint Orderflow indicator is one of the most advanced visual tools available on the NinjaTrader platform, providing tick-by-tick microstructure analysis of the market.
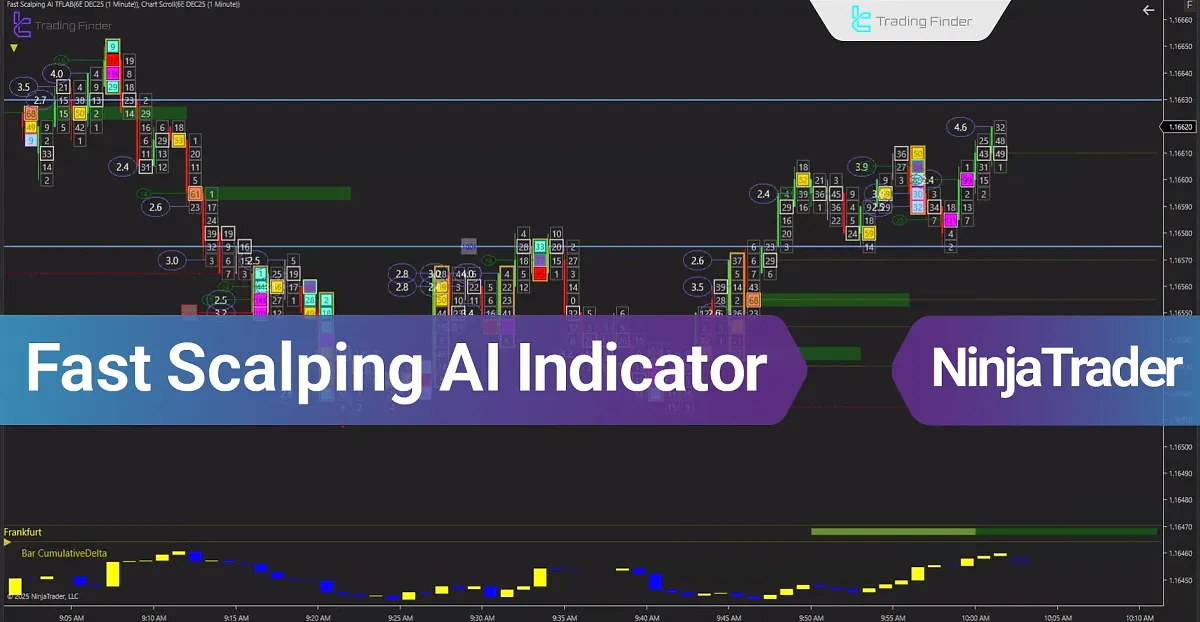
Fast Scalping AI NinjaTrader 8 Indicator
The Fast Scalping AI Indicator in NinjaTrader, developed based on Volume Trading data, becomes fully accessible after NinjaTrader Registration and uses artificial intelligence to analyze high-pressure trading patterns within short timeframes. This Buy and Sell Volume Indicator is designed specifically for scalping and provides accurate order flow visualization, enabling detailed market microstructure analysis.
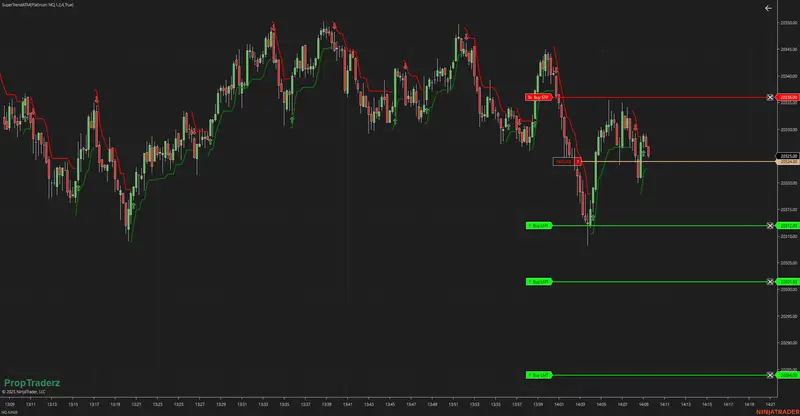
SuperTrend ATM Strategy Guide for NinjaTrader 8
Welcome to the official overview of the SuperTrendATM strategy coded by InfinityAlgo. This automated trading tool is designed to simplify execution using ATM (Advanced Trade Management) templates while leveraging the power of SuperTrend logic for directional bias.
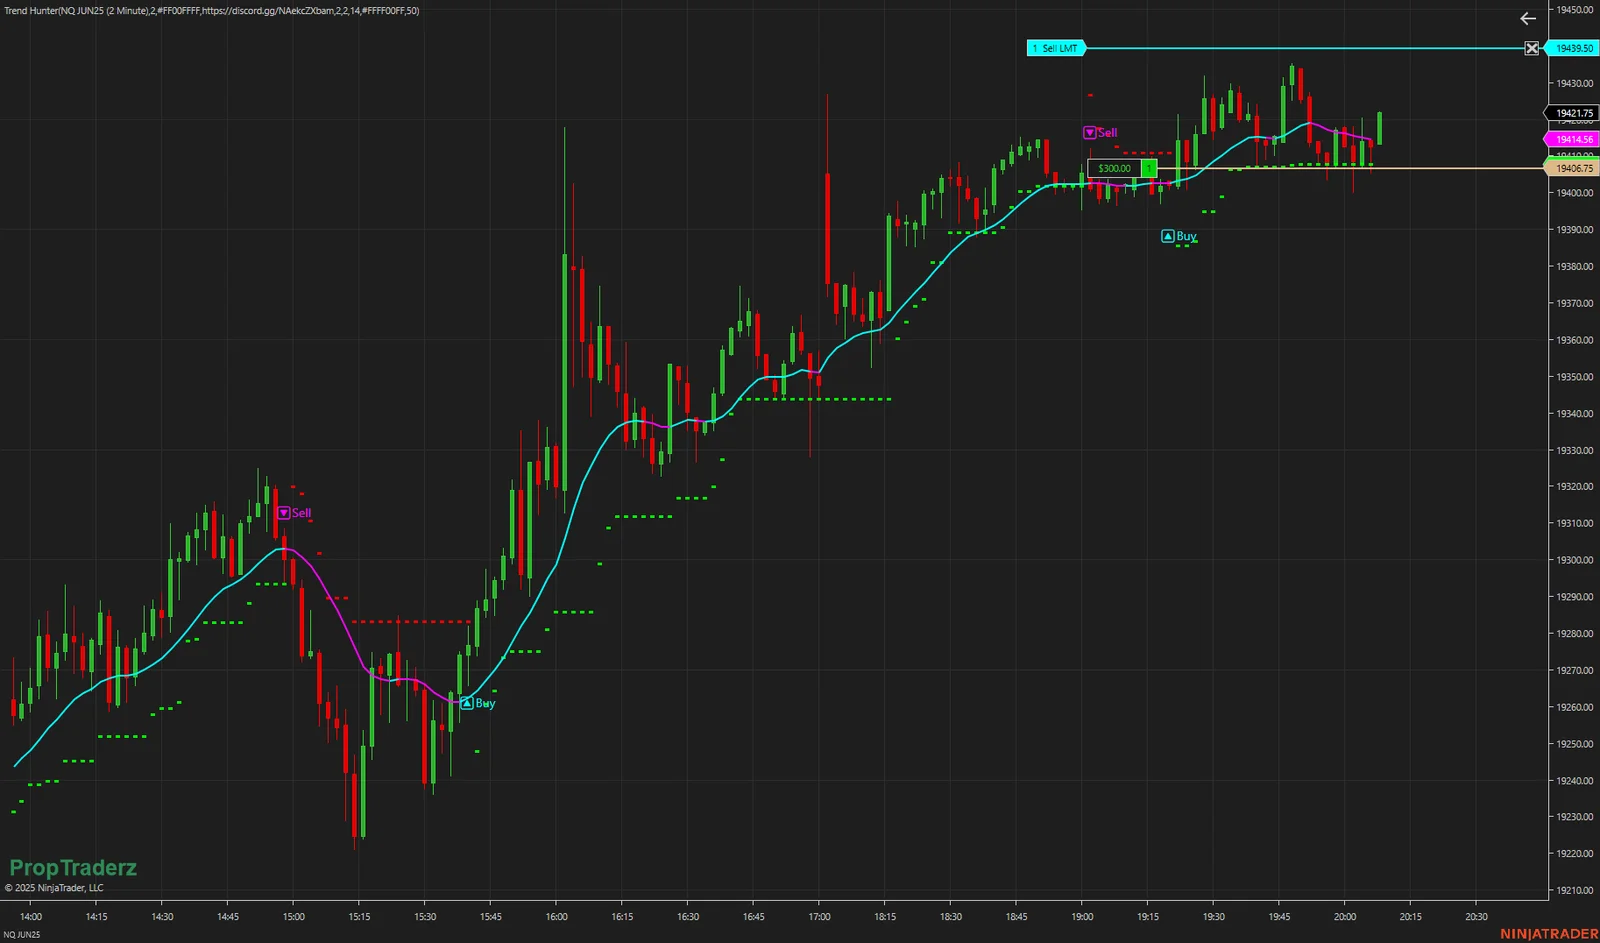
Trend Hunter: Heiken-Ashi + SuperTrend in One Indicator
Trend Hunter is a NinjaTrader 8 overlay that combines smooth Heiken-Ashi mid-line logic with SuperTrend-style stop bands—and then drops clear “🔼Buy” or “🔽Sell” labels when your smoothed Heiken line and SuperTrend agree on direction.