
![Dynamic Liquidity HeatMap Profile [BigBeluga]](https://infinityalgoacademy.net/wp-content/uploads/2026/02/Dynamic-Liquidity-HeatMap-Profile-BigBeluga-—-Indicator-by-BigBeluga-18-02-2026_20_49-scaled.png)
Dynamic Liquidity HeatMap Profile [BigBeluga]
The Dynamic Liquidity HeatMap Profile is a smart-flow liquidity tracker that maps where stop-loss clusters and resting limit orders are likely positioned Instead of traditional volume profiles based only on executed transactions, this tool projects probable liquidity pools areas where traders are trapped or positioned and where smart money may hunt stops or fill orders.
The Dynamic Liquidity HeatMap Profile [BigBeluga] is a smart-flow liquidity tracker that maps where stop-loss clusters and resting limit orders are likely positioned.
Instead of traditional volume profiles based only on executed transactions, this tool projects probable liquidity pools — areas where traders are trapped or positioned and where smart money may hunt stops or fill orders.
It dynamically scans recent price swings, builds liquidity zones above and below price, and visualizes them as a heat map + histogram — highlighting areas with the greatest liquidity attraction.
Orange highlights the highest-concentration liquidity (POC), making potential sweep targets obvious.
🔵 CONCEPTS
- Liquidity pools form above swing highs (buy stops) and below swing lows (sell stops).
- Market makers & large players often push price into these zones to trigger stops and capture liquidity.
- The indicator uses recent volatility + volume expansion to estimate where these pools exist.
- Horizontal heat bars show depth and intensity of probable liquidity.
- Profile side histogram displays buy-side vs sell-side liquidity distribution.
🔵 FEATURES
- Dynamic Liquidity Detection — finds potential stop-loss clusters from recent swing behavior.
- Dual-Side Heatmap — split liquidity view above (short stops) and below (long stops) current price.
- Volume-Weighted Levels — higher volatility & volume = deeper liquidity expectation.
- Real-Time Heat Coloring
• Lime = liquidity below price (potential buy-side fuel)
• Blue = liquidity above price (potential sell-side fuel)
• Orange = peak liquidity (POC) - Liquidity Profile Histogram — plotted at right side, layered by strength.
- Auto-Cleaning Engine — removes invalidated liquidity after breaks.
- Adjustable lookback window and bin resolution.
🔵 HOW TO USE
- Look for price moving toward dense liquidity zones — high probability of wick raids or sweeps.
- Orange POC often acts as magnet — strong target zone for smart money.
- Combine with SFP / BOS logic to time reversals after liquidity hunts.
- In trend, price repeatedly sweeps opposite-side liquidity before continuation.
- Use liquidity walls as bias filters — heavy liquidity above often precedes downward move, and vice-versa.
- Great for scalping sessions, indices, FX, BTC, ETH.
🔵 CONCLUSION
The Dynamic Liquidity HeatMap Profile [BigBeluga] gives traders a tactical edge by revealing where the market’s hidden liquidity resides.
It highlights where shorts and longs are positioned, identifies likely sweep zones, and marks the most attractive liquidity magnet (POC).
Use it to anticipate stop hunts, avoid getting trapped, and align with smart-money flow instead of fighting it.
Related Products

Dual Structural Trendline Fib Channel Free Download
Dual Structural Trendline Fib Channel is a structural analysis indicator that automatically constructs dual trendline channels using pivot-based slope logic.
![Wedge Pattern [InfinityAlgo] Free Download](https://infinityalgoacademy.net/wp-content/uploads/2026/02/Wedge-Pattern-UAlgo-—-Indicator-by-UAlgo-—-TradingView-22-02-2026_21_34-scaled.png)
Wedge Pattern [InfinityAlgo] Free Download
Wedge Pattern is a chart overlay that detects rising and falling wedge formations using strict pivot based rules and a validation engine that enforces classic technical analysis requirements. The script builds two trendlines from confirmed pivot highs and pivot lows

Volatility Aggregation Model Tradingview
Volatility Aggregation Model (VAM) is a very simple overlay indicator that classifies market direction using a five-speed ensemble of volatility-adaptive range engines. Instead of relying on a single trend filter, VAM evaluates direction across multiple responsiveness settings and converts those states into a normalized score
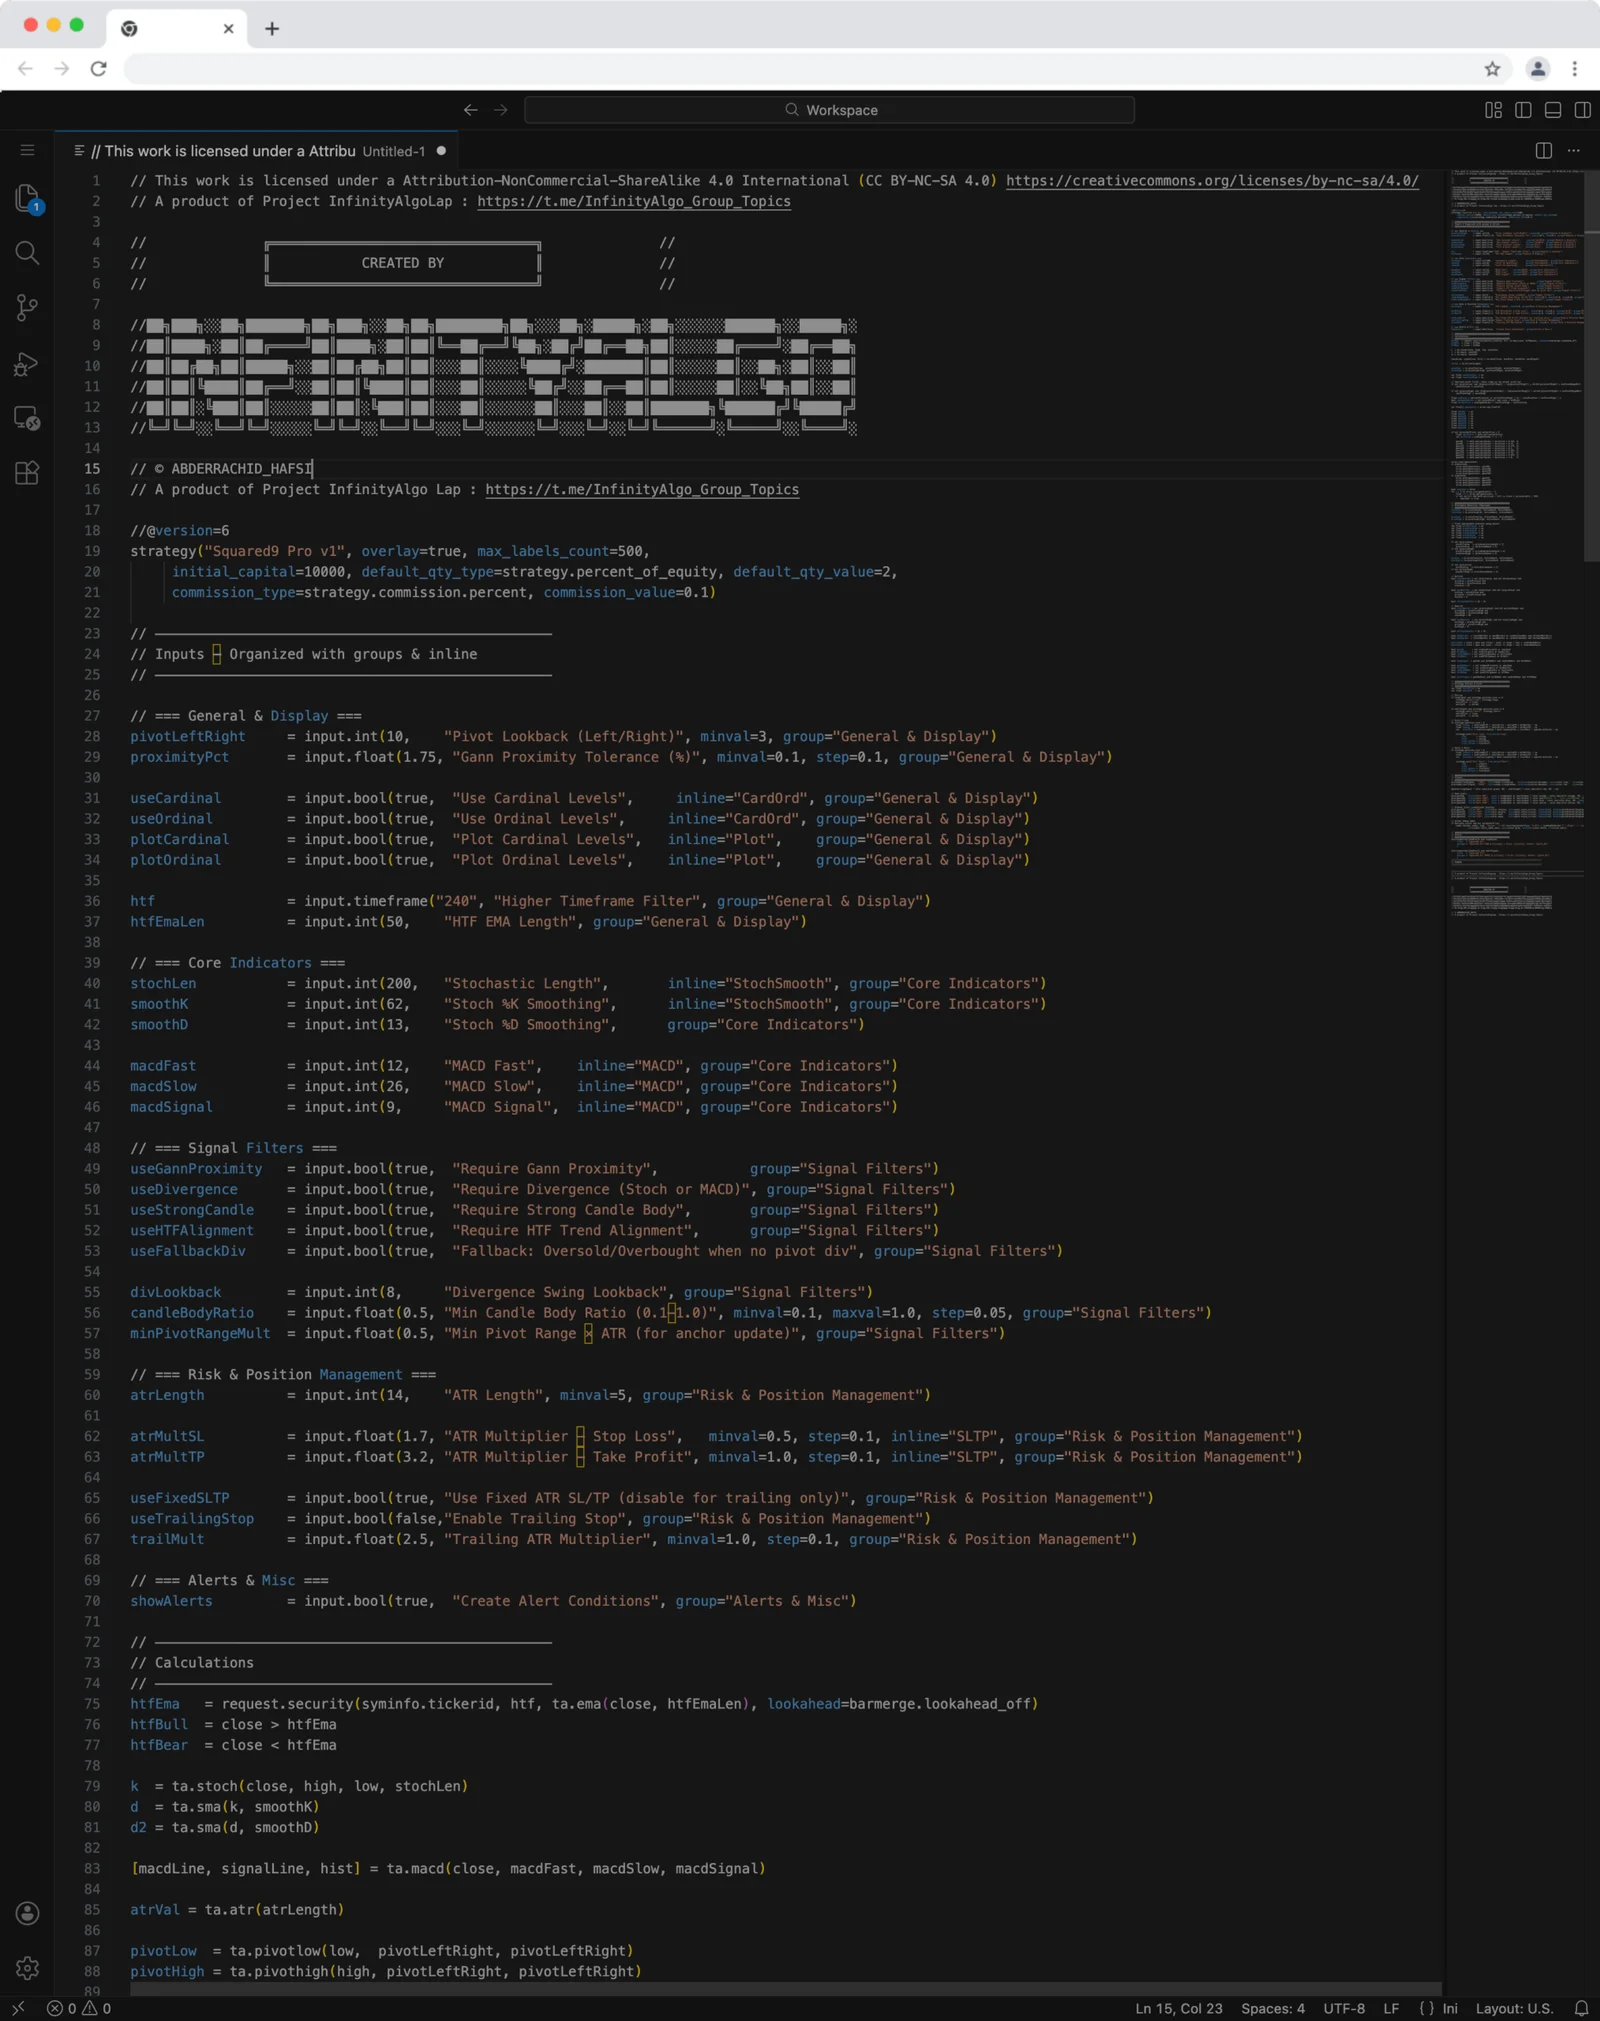
Squared9 Pro v1 Tradingview Free Download - PineScript
Squared9 Pro v1.0 (strategy) combines classic Gann geometry with modern momentum checks to find high-conviction reversal zones.
![Impulse Trend Levels [InfinityAlgo]](https://infinityalgoacademy.net/wp-content/uploads/2026/02/Impulse-Trend-Levels-BOSWaves-—-Indicator-by-BOSWaves-—-TradingView-19-02-2026_19_05-scaled.png)
Impulse Trend Levels [InfinityAlgo]
Impulse Trend Levels [InfinityAlgo] is a momentum-aware trend identification system that tracks directional price movement through adaptive confidence bands, where band width dynamically adjusts based on impulse strength and freshness to reflect real-time conviction in the current trend direction.