
Deeptest Tradinview Indicator free download
Deeptest is a Pine Script library that provides quantitative analysis tools for strategy backtesting. It calculates over 100 statistical metrics including risk-adjusted return ratios (Sharpe, Sortino, Calmar), drawdown analysis, Value at Risk (VaR), Conditional VaR, and performs Monte Carlo simulation and Walk-Forward Analysis.
OVERVIEW
Deeptest is a Pine Script library that provides quantitative analysis tools for strategy backtesting. It calculates over 100 statistical metrics including risk-adjusted return ratios (Sharpe, Sortino, Calmar), drawdown analysis, Value at Risk (VaR), Conditional VaR, and performs Monte Carlo simulation and Walk-Forward Analysis.
snapshot
█ WHY THIS LIBRARY MATTERS
Pine Script is a simple yet effective coding language for algorithmic and quantitative trading. Its accessibility enables traders to quickly prototype and test ideas directly within TradingView. However, the built-in strategy tester provides only basic metrics (net profit, win rate, drawdown), which is often insufficient for serious strategy evaluation.
Due to this limitation, many traders migrate to alternative backtesting platforms that offer comprehensive analytics. These platforms require other language programming knowledge, environment setup, and significant time investment—often just to test a simple trading idea.
Deeptest bridges this gap by bringing institutional-level quantitative analytics directly to Pine Script. Traders can now perform sophisticated analysis without leaving TradingView or learning complex external platforms. All calculations are derived from strategy.closedtrades.* , ensuring compatibility with any existing Pine Script strategy.
━━━━━━━━━━━━━━━━━━━━━━━━━━━━━━━━━━
█ ORIGINALITY AND USEFULNESS
This library is original work that adds value to the TradingView community in the following ways:
1. Comprehensive Metric Suite: Implements 112+ statistical calculations in a single library, including advanced metrics not available in TradingView’s built-in tester (p-value, Z-score, Skewness, Kurtosis, Risk of Ruin).
2. Monte Carlo Simulation: Implements trade-sequence randomization to stress-test strategy robustness by simulating 1000+ alternative equity curves.
3. Walk-Forward Analysis: Divides historical data into rolling in-sample and out-of-sample windows to detect overfitting by comparing training vs. testing performance.
4. Rolling Window Statistics: Calculates time-varying Sharpe, Sortino, and Expectancy to analyze metric consistency throughout the backtest period.
5. Interactive Table Display: Renders professional-grade tables with color-coded thresholds, tooltips explaining each metric, and period analysis cards for drawdowns/trades.
6. Benchmark Comparison: Automatically fetches S&P 500 data to calculate Alpha, Beta, and R-squared, enabling objective assessment of strategy skill vs. passive investing.
snapshot
━━━━━━━━━━━━━━━━━━━━━━━━━━━━━━━━━━
█ KEY FEATURES
Performance Metrics
Net Profit, CAGR, Monthly Return, Expectancy
Profit Factor, Payoff Ratio, Sample Size
Compounding Effect Analysis
Risk Metrics
Sharpe Ratio, Sortino Ratio, Calmar Ratio (MAR)
Martin Ratio, Ulcer Index
Max Drawdown, Average Drawdown, Drawdown Duration
Risk of Ruin, R-squared (equity curve linearity)
Statistical Distribution
Value at Risk (VaR 95%), Conditional VaR
Skewness (return asymmetry)
Kurtosis (tail fatness)
Z-Score, p-value (statistical significance testing)
Trade Analysis
Win Rate, Breakeven Rate, Loss Rate
Average Trade Duration, Time in Market
Consecutive Win/Loss Streaks with Expected values
Top/Worst Trades with R-multiple tracking
Advanced Analytics
Monte Carlo Simulation (1000+ iterations)
Walk-Forward Analysis (rolling windows)
Rolling Statistics (time-varying metrics)
Out-of-Sample Testing
Benchmark Comparison
Alpha (excess return vs. benchmark)
Beta (systematic risk correlation)
Buy & Hold comparison
R-squared vs. benchmark
snapshot
━━━━━━━━━━━━━━━━━━━━━━━━━━━━━━━━━━
█ QUICK START
Basic Usage
Pine Script®
//@version=6
strategy(“My Strategy”, overlay=true)
// Import the library
import Fractalyst/Deeptest/1 as *
// Your strategy logic
fastMA = ta.sma(close, 10)
slowMA = ta.sma(close, 30)
if ta.crossover(fastMA, slowMA)
strategy.entry(“Long”, strategy.long)
if ta.crossunder(fastMA, slowMA)
strategy.close(“Long”)
// Run the analysis
DT.runDeeptest()
Expand 12 lines
━━━━━━━━━━━━━━━━━━━━━━━━━━━━━━━━━━
█ METRIC EXPLANATIONS
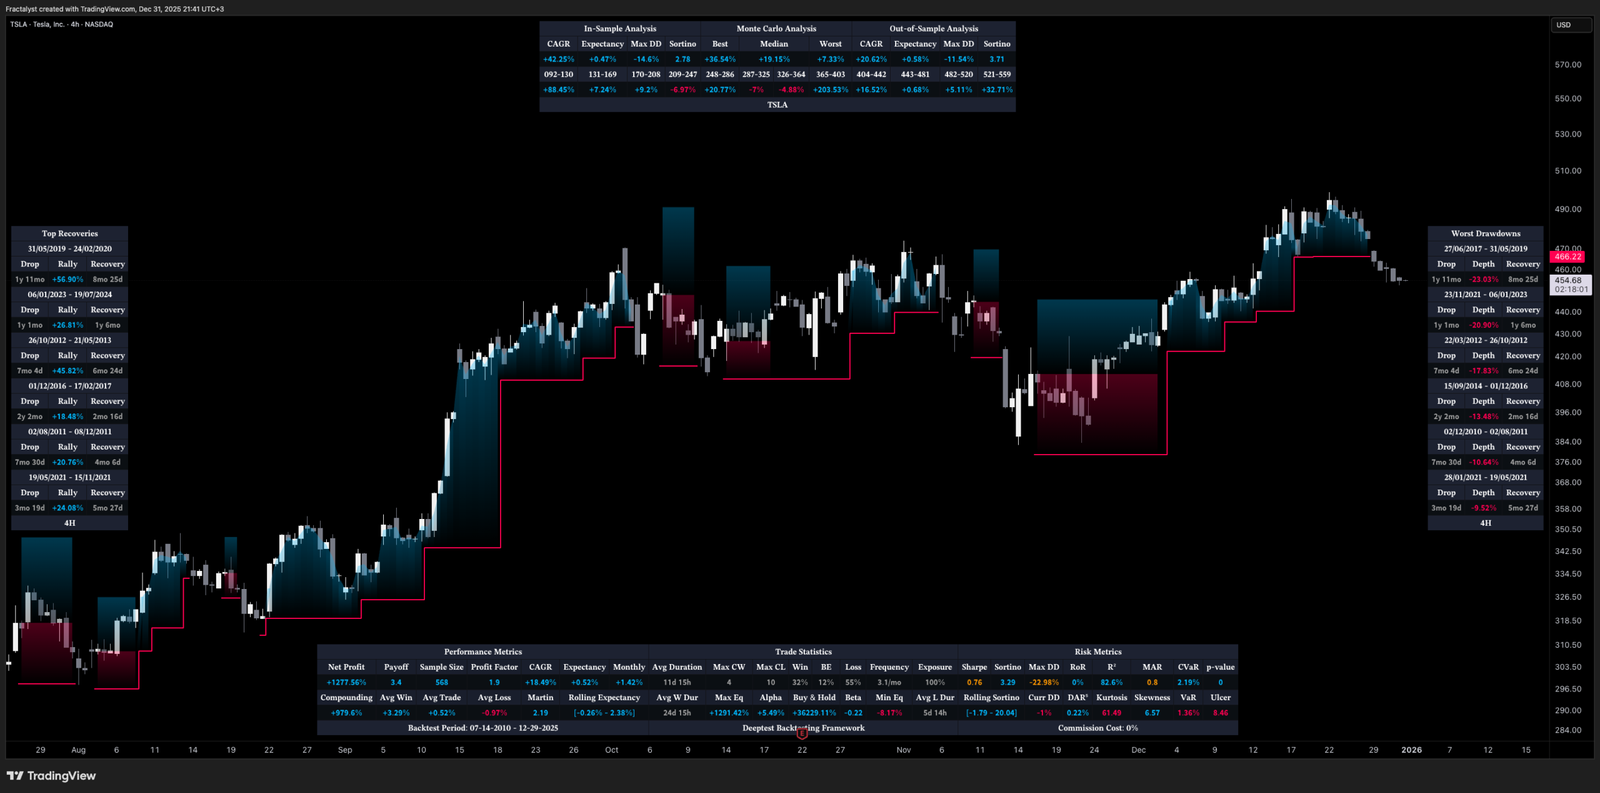
The Deeptest table displays 23 metrics across the main row, with 23 additional metrics in the complementary row. Each metric includes detailed tooltips accessible by hovering over the value.
Main Row — Performance Metrics (Columns 0-6)
Net Profit — (Final Equity – Initial Capital) / Initial Capital × 100
— >20%: Excellent, >0%: Profitable, <0%: Loss
— Total return percentage over entire backtest period
Payoff Ratio — Average Win / Average Loss
— >1.5: Excellent, >1.0: Good, <1.0: Losses exceed wins
— Average winning trade size relative to average losing trade. Breakeven win rate = 100% / (1 + Payoff)
Sample Size — Count of closed trades
— >=30: Statistically valid, <30: Insufficient data
— Number of completed trades. Includes 95% confidence interval for win rate in tooltip
Profit Factor — Gross Profit / Gross Loss
— >=1.5: Excellent, >1.0: Profitable, <1.0: Losing
— Ratio of total winnings to total losses. Uses absolute values unlike payoff ratio
CAGR — (Final / Initial)^(365.25 / Days) – 1
— >=10%: Excellent, >0%: Positive growth
— Compound Annual Growth Rate – annualized return accounting for compounding
Expectancy — Sum of all returns / Trade count
— >0.20%: Excellent, >0%: Positive edge
— Average return per trade as percentage. Positive expectancy indicates profitable edge
Monthly Return — Net Profit / (Months in test)
— >0%: Profitable month average
— Average monthly return. Geometric monthly also shown in tooltip
Main Row — Trade Statistics (Columns 7-14)
Avg Duration — Average time in position per trade
— Mean holding period from entry to exit. Influenced by timeframe and trading style
Max CW — Longest consecutive winning streak
— Maximum consecutive wins. Expected value = ln(trades) / ln(1/winRate)
Max CL — Longest consecutive losing streak
— Maximum consecutive losses. Important for psychological risk tolerance
Win Rate — Wins / Total Trades
— Higher is better
— Percentage of profitable trades. Breakeven win rate shown in tooltip
BE Rate — Breakeven Trades / Total Trades
— Lower is better
— Percentage of trades that broke even (neither profit nor loss)
Loss Rate — Losses / Total Trades
— Lower is better
— Percentage of unprofitable trades. Together with win rate and BE rate, sums to 100%
Frequency — Trades per month
— Trading activity level. Displays intelligently (e.g., “12/mo”, “1.5/wk”, “3/day”)
Exposure — Time in market / Total time × 100
— Lower = less risk
— Percentage of time the strategy had open positions
Main Row — Risk Metrics (Columns 15-22)
Sharpe Ratio — (Return – Rf) / StdDev × sqrt(Periods)
— >=3: Excellent, >=2: Good, >=1: Fair, <1: Poor
— Measures risk-adjusted return using total volatility. Annualized using sqrt(252) for daily
Sortino Ratio — (Return – Rf) / DownsideDev × sqrt(Periods)
— >=2: Excellent, >=1: Good, <1: Needs improvement
— Similar to Sharpe but only penalizes downside volatility. Can be higher than Sharpe
Max DD — (Peak – Trough) / Peak × 100
— <5%: Excellent, 5-15%: Moderate, 15-30%: High, >30%: Severe
— Largest peak-to-trough decline in equity. Critical for risk tolerance and position sizing
RoR — Risk of Ruin probability
— <1%: Excellent, 1-5%: Acceptable, 5-10%: Elevated, >10%: Dangerous
— Probability of losing entire trading account based on win rate and payoff ratio
R² — R-squared of equity curve vs. time
— >=0.95: Excellent, 0.90-0.95: Good, 0.80-0.90: Moderate, <0.80: Erratic
— Coefficient of determination measuring linearity of equity growth
MAR — CAGR / |Max Drawdown|
— Higher is better, negative = bad
— Calmar Ratio. Reward relative to worst-case loss. Negative if max DD exceeds CAGR
CVaR — Average of returns below VaR threshold
— Lower absolute is better
— Conditional Value at Risk (Expected Shortfall). Average loss in worst 5% of outcomes
p-value — Binomial test probability
— <0.05: Significant, 0.05-0.10: Marginal, >0.10: Likely random
— Probability that observed results are due to chance. Low p-value means statistically significant edge
snapshot
Complementary Row — Extended Metrics
Compounding — (Compounded Return / Total Return) × 100
— Percentage of total profit attributable to compounding (position sizing)
Avg Win — Sum of wins / Win count
— Average profitable trade return in percentage
Avg Trade — Sum of all returns / Total trades
— Same as Expectancy (Column 5). Displayed here for convenience
Avg Loss — Sum of losses / Loss count
— Average unprofitable trade return in percentage (negative value)
Martin Ratio — CAGR / Ulcer Index
— Similar to Calmar but uses Ulcer Index instead of Max DD
Rolling Expectancy — Mean of rolling window expectancies
— Average expectancy calculated across rolling windows. Shows consistency of edge
Avg W Dur — Avg duration of winning trades
— Average time from entry to exit for winning trades only
Max Eq — Highest equity value reached
— Peak equity achieved during backtest
Min Eq — Lowest equity value reached
— Trough equity point. Important for understanding worst-case absolute loss
Buy & Hold — (Close_last / Close_first – 1) × 100
— >0%: Passive profit
— Return of simply buying and holding the asset from backtest start to end
Alpha — Strategy CAGR – Benchmark CAGR
— >0: Has skill (beats benchmark)
— Excess return above passive benchmark. Positive alpha indicates genuine value-added skill
Beta — Covariance(Strategy, Benchmark) / Variance(Benchmark)
— <1: Less volatile than market, >1: More volatile
— Systematic risk correlation with benchmark
Avg L Dur — Avg duration of losing trades
— Average time from entry to exit for losing trades only
Rolling Sharpe/Sortino — Dynamic based on win rate
— >2: Good consistency
— Rolling metric across sliding windows. Shows Sharpe if win rate >50%, Sortino if <=50%
Curr DD — Current drawdown from peak
— Lower is better
— Present drawdown percentage. Zero means at new equity high
DAR — CAGR adjusted for target DD
— Higher is better
— Drawdown-Adjusted Return. DAR^5 = CAGR if max DD = 5%
Kurtosis — Fourth moment / StdDev^4 – 3
— ~0: Normal, >0: Fat tails, <0: Thin tails
— Measures “tailedness” of return distribution (excess kurtosis)
Skewness — Third moment / StdDev^3
— >0: Positive skew (big wins), <0: Negative skew (big losses)
— Return distribution asymmetry
VaR — 5th percentile of returns
— Lower absolute is better
— Value at Risk at 95% confidence. Maximum expected loss in worst 5% of outcomes
Ulcer — sqrt(mean(drawdown^2))
— Lower is better
— Ulcer Index – root mean square of drawdowns. Penalizes both depth AND duration
snapshot
━━━━━━━━━━━━━━━━━━━━━━━━━━━━━━━━━━
█ MONTE CARLO SIMULATION
Purpose
Monte Carlo simulation tests strategy robustness by randomizing the order of trades while keeping trade returns unchanged. This simulates alternative equity curves to assess outcome variability.
Method
Extract all historical trade returns
Randomly shuffle the sequence (1000+ iterations)
Calculate cumulative equity for each shuffle
Build distribution of final outcomes
Output
The stress test table shows:
Median Outcome: 50th percentile result
5th Percentile: Worst 5% of outcomes
95th Percentile: Best 95% of outcomes
Success Rate: Percentage of simulations that were profitable
Interpretation
If 95% of simulations are profitable: Strategy is robust
If median is far from actual result: High variance/unreliability
If 5th percentile shows large loss: High tail risk
snapshot
━━━━━━━━━━━━━━━━━━━━━━━━━━━━━━━━━━
█ WALK-FORWARD ANALYSIS
Purpose
Walk-Forward Analysis (WFA) is the gold standard for detecting strategy overfitting. It simulates real-world trading by dividing historical data into rolling “training” (in-sample) and “validation” (out-of-sample) periods. A strategy that performs well on unseen data is more likely to succeed in live trading.
Method
The implementation uses a non-overlapping window approach following AmiBroker’s gold standard methodology:
Segment Calculation: Total trades divided into N windows (default: 12), IS = ~75%, OOS = ~25%, Step = OOS length
Window Structure: Each window has IS (training) followed by OOS (validation). Each OOS becomes the next window’s IS (rolling forward)
Metrics Calculated: CAGR, Sharpe, Sortino, MaxDD, Win Rate, Expectancy, Profit Factor, Payoff
Aggregation: IS metrics averaged across all IS periods, OOS metrics averaged across all OOS periods
Output
IS CAGR: In-sample annualized return
OOS CAGR: Out-of-sample annualized return (THE key metric)
IS/OOS Sharpe: In/out-of-sample risk-adjusted return
Success Rate: % of OOS windows that were profitable
Interpretation
Robust: IS/OOS CAGR gap <20%, OOS Success Rate >80%
Some Overfitting: CAGR gap 20-50%, Success Rate 50-80%
Severe Overfitting: CAGR gap >50%, Success Rate <50%
Key Principles:
OOS is what matters — Only OOS predicts live performance
Consistency > Magnitude — 10% IS / 9% OOS beats 30% IS / 5% OOS
Window count — More windows = more reliable validation
Non-overlapping OOS — Prevents data leakage
snapshot
━━━━━━━━━━━━━━━━━━━━━━━━━━━━━━━━━━
█ TABLE DISPLAY
Main Table — Organized into three sections:
Performance Metrics (Cols 0-6): Net Profit, Payoff, Sample Size, Profit Factor, CAGR, Expectancy, Monthly
Trade Statistics (Cols 7-14): Avg Duration, Max CW, Max CL, Win, BE, Loss, Frequency, Exposure
Risk Metrics (Cols 15-22): Sharpe, Sortino, Max DD, RoR, R², MAR, CVaR, p-value
Color Coding
🟢 Green: Excellent performance
🟠 Orange: Acceptable performance
⚪ Gray: Neutral / Fair
🔴 Red: Poor performance
━━━━━━━━━━━━━━━━━━━━━━━━━━━━━━━━━━
█ IMPLEMENTATION NOTES
Data Source: All metrics calculated from strategy.closedtrades, ensuring compatibility with any Pine Script strategy
Calculation Timing: All calculations occur on barstate.islastconfirmedhistory to optimize performance
Limitations: Requires at least 1 closed trade for basic metrics, 30+ trades for reliable statistical analysis
━━━━━━━━━━━━━━━━━━━━━━━━━━━━━━━━━━
█ QUICK NOTES
➙ This library has been developed and refined over two years of real-world strategy testing. Every calculation has been validated against industry-standard quantitative finance references.
➙ The entire codebase is thoroughly documented inline. If you are curious about how a metric is calculated or want to understand the implementation details, dive into the source code — it is written to be read and learned from.
➙ This description focuses on usage and concepts rather than exhaustively listing every exported type and function. The library source code is thoroughly documented inline — explore it to understand implementation details and internal logic.
➙ All calculations execute on barstate.islastconfirmedhistory to minimize runtime overhead. The library is designed for efficiency without sacrificing accuracy.
➙ Beyond analysis, this library serves as a learning resource. Study the source code to understand quantitative finance concepts, Pine Script advanced techniques, and proper statistical methodology.
➙ Metrics are their own not binary good/bad indicators. A high Sharpe ratio with low sample size is misleading. A deep drawdown during a market crash may be acceptable. Study each function and metric individually — evaluate your strategy contextually, not by threshold alone.
➙ All strategies face alpha decay over time. Instead of over-optimizing a single strategy on one timeframe and market, build a diversified portfolio across multiple markets and timeframes. Deeptest helps you validate each component so you can combine robust strategies into a trading portfolio.
➙ Screenshots shown in the documentation are solely for visual representation to demonstrate how the tables and metrics will be displayed. Please do not compare your strategy’s performance with the metrics shown in these screenshots — they are illustrative examples only, not performance targets or benchmarks.
━━━━━━━━━━━━━━━━━━━━━━━━━━━━━━━━━━
█ HOW-TO
Using Deeptest is intentionally straightforward. Just import the library and call
Pine Script®
DT.runDeeptest()
at the end of your strategy code in main scope. .
Pine Script®
//@version=6
strategy(“My Strategy”, overlay=true)
// Import the library
import Fractalyst/Deeptest/1 as DT
// Your strategy logic
fastMA = ta.sma(close, 10)
slowMA = ta.sma(close, 30)
if ta.crossover(fastMA, slowMA)
strategy.entry(“Long”, strategy.long)
if ta.crossunder(fastMA, slowMA)
strategy.close(“Long”)
// Run the analysis
DT.runDeeptest()
Expand 12 lines
And yes… it’s compatible with any TradingView Strategy! 🪄
━━━━━━━━━━━━━━━━━━━━━━━━━━━━━━━━━━
█ CREDITS
Author: Fractalyst
Font Library: by fikira – kaigouthro – Duyck
Community: Inspired by the PineCoders community initiative, encouraging developers to contribute open-source libraries and continuously enhance the Pine Script ecosystem for all traders.
if you find Deeptest valuable in your trading journey, feel free to use it in your strategies and give a shoutout to Fractalyst — Your recognition directly supports ongoing development and open-source contributions to Pine Script.
━━━━━━━━━━━━━━━━━━━━━━━━━━━━━━━━━━
█ DISCLAIMER
This library is provided for educational and research purposes. Past performance does not guarantee future results. Always test thoroughly and use proper risk management. The author is not responsible for any trading losses incurred through the use of this code.
3 days ago
Release Notes
v2
Updated:
runDeeptest(riskPerTrade, targetMaxDDPct, showStressTest, showPeriodCards, wfaWindows, mcSimulations, bullColor, bearColor, commissionInfo, benchmarkReturns, benchmarkSymbol, periodCardMode, tradeSortBy, textSize)
Parameters:
riskPerTrade (float)
targetMaxDDPct (float)
showStressTest (bool)
showPeriodCards (bool)
wfaWindows (int)
mcSimulations (int)
bullColor (color)
bearColor (color)
commissionInfo (string)
benchmarkReturns (array<float>)
benchmarkSymbol (string)
periodCardMode (string)
tradeSortBy (string)
textSize (string)
Related Products

Dual Structural Trendline Fib Channel Free Download
Dual Structural Trendline Fib Channel is a structural analysis indicator that automatically constructs dual trendline channels using pivot-based slope logic.
![Wedge Pattern [InfinityAlgo] Free Download](https://infinityalgoacademy.net/wp-content/uploads/2026/02/Wedge-Pattern-UAlgo-—-Indicator-by-UAlgo-—-TradingView-22-02-2026_21_34-scaled.png)
Wedge Pattern [InfinityAlgo] Free Download
Wedge Pattern is a chart overlay that detects rising and falling wedge formations using strict pivot based rules and a validation engine that enforces classic technical analysis requirements. The script builds two trendlines from confirmed pivot highs and pivot lows

Volatility Aggregation Model Tradingview
Volatility Aggregation Model (VAM) is a very simple overlay indicator that classifies market direction using a five-speed ensemble of volatility-adaptive range engines. Instead of relying on a single trend filter, VAM evaluates direction across multiple responsiveness settings and converts those states into a normalized score
Quantum Emperor MT4 Free Download
Introducing Quantum Emperor EA, the groundbreaking MQL5 expert advisor that's transforming the way you trade the prestigious GBPUSD pair! Developed by a team of experienced traders with trading experience of over 13 years.
CyNera MT4 Free Download
Trading gold, one of the most volatile instruments in the market, demands precision, in-depth analysis, and strong risk management. CyNera Expert Advisor seamlessly integrates these elements into a sophisticated system designed for optimal gold trading.