
![Breaker Blocks with Signals [LuxAlgo]](https://infinityalgoacademy.net/wp-content/uploads/2026/02/Breaker-Blocks-with-Signals-LuxAlgo1.png)
Breaker Blocks with Signals [LuxAlgo]
The Breaker Blocks with Signals indicator aims to highlight a complete methodology based on breaker blocks. Breakout signals between the price and breaker blocks are highlighted and premium/discount swing levels are included to provide potential take profit/stop loss levels.
This script also includes alerts for each signal highlighted.
🔶 SETTINGS
🔹 Breaker Blocks
- Length: Sensitivity of the detected swings used to construct breaker blocks. Higher values will return longer term breaker blocks.
- Use only candle body: Only use the candle body when determining the maximum/minimum extremities of the order blocks.
- Use 2 candles instead of 1: Use two candles to confirm the occurrence of a breaker block.
- Stop at first break of center line: Do not highlight breakout signals after invalidation until reset.
🔹 PD Array
- Only when E is in premium/discount zone: Only set breaker block if point E of wave ABCDE is within the corresponding zone.
- Show premium discount zone: Show premium/discount zone.
- Highlight Swing Break: Highlight occurrences of price breaking a previous swing level.
- Show Swings/PD Arrays: Show swing levels/labels and pd areas.
🔶 USAGE
The Breaker Blocks with Signals indicator aims to provide users with a minimalistic display alongside optimal signals to be aware of for finding trade setups as shown below.Here we can see a MSS occurred allowing the indicator to detect a Breaker Block (-BB) & display a red arrow to confirm this signal.
The signal(s) that can be used for potential entries are only during retests of the breaker blocks.
A potential strategy traders could use with this indicator is to target the corresponding Discount PD Arrays detected (for a short position) and Premium PD Arrays (for a long position).In the image above we can see price generated the potential entry signals in orange & fell to the Discount PD Arrays as a logical setup to look for with this indicator.
As we can see in the image above, signals can be considered invalid when price closes above the 50% level in which it would be suggested to wait for another setup.
Users still looking for more potential setups based on the same breaker block can disable the “Stop at first break of center line” setting within the settings menu.In the image above we can see a bullish example whereas price confirmed a bullish breaker block (+BB), had a quick pullback into it that was confirmed by the green arrow, and then reached the Premium PD Arrays.
While retests of breaker blocks can still function well if they occur later in the price action, it’s most preferable for users to look for entry signals that are near confirmed breaker blocks (5-10 bars) opposed to waiting 20+ bars.
Additional take profits based on the occurence of the breaker blocks are given in order to provide targets after the occurence of a breaker block breakout.
🔶 DETAILSBreaker blocks are formed after a mitigated order block, these can provide change of polarity opportunities, thus playing a role as a potential support/resistance. It is the re-test/retrace of price to a breaker block that will set the conditions to provide signals.
The above chart describes the creation of a breaker block.
The signal generation logic makes use of various rules described below:
Bullish Breaker Blocks:
- opening price is within the breaker block, while the closing price is above the upper extremity of the breaker block.
- Price did not cross the breaker block average in the interval since the previous breakout.
Bearish Breaker Blocks:
- opening price is within the breaker block, while the closing price is below the lower extremity of the breaker block.
- Price did not cross the breaker block average in the interval since the previous breakout
When a new pattern is formed, all previous drawings are removed.
🔶 RELATED SCRIPTS
Changed styling & added functionality to support light-themed charts.
Related Products

Dual Structural Trendline Fib Channel Free Download
Dual Structural Trendline Fib Channel is a structural analysis indicator that automatically constructs dual trendline channels using pivot-based slope logic.
![Wedge Pattern [InfinityAlgo] Free Download](https://infinityalgoacademy.net/wp-content/uploads/2026/02/Wedge-Pattern-UAlgo-—-Indicator-by-UAlgo-—-TradingView-22-02-2026_21_34-scaled.png)
Wedge Pattern [InfinityAlgo] Free Download
Wedge Pattern is a chart overlay that detects rising and falling wedge formations using strict pivot based rules and a validation engine that enforces classic technical analysis requirements. The script builds two trendlines from confirmed pivot highs and pivot lows

Volatility Aggregation Model Tradingview
Volatility Aggregation Model (VAM) is a very simple overlay indicator that classifies market direction using a five-speed ensemble of volatility-adaptive range engines. Instead of relying on a single trend filter, VAM evaluates direction across multiple responsiveness settings and converts those states into a normalized score
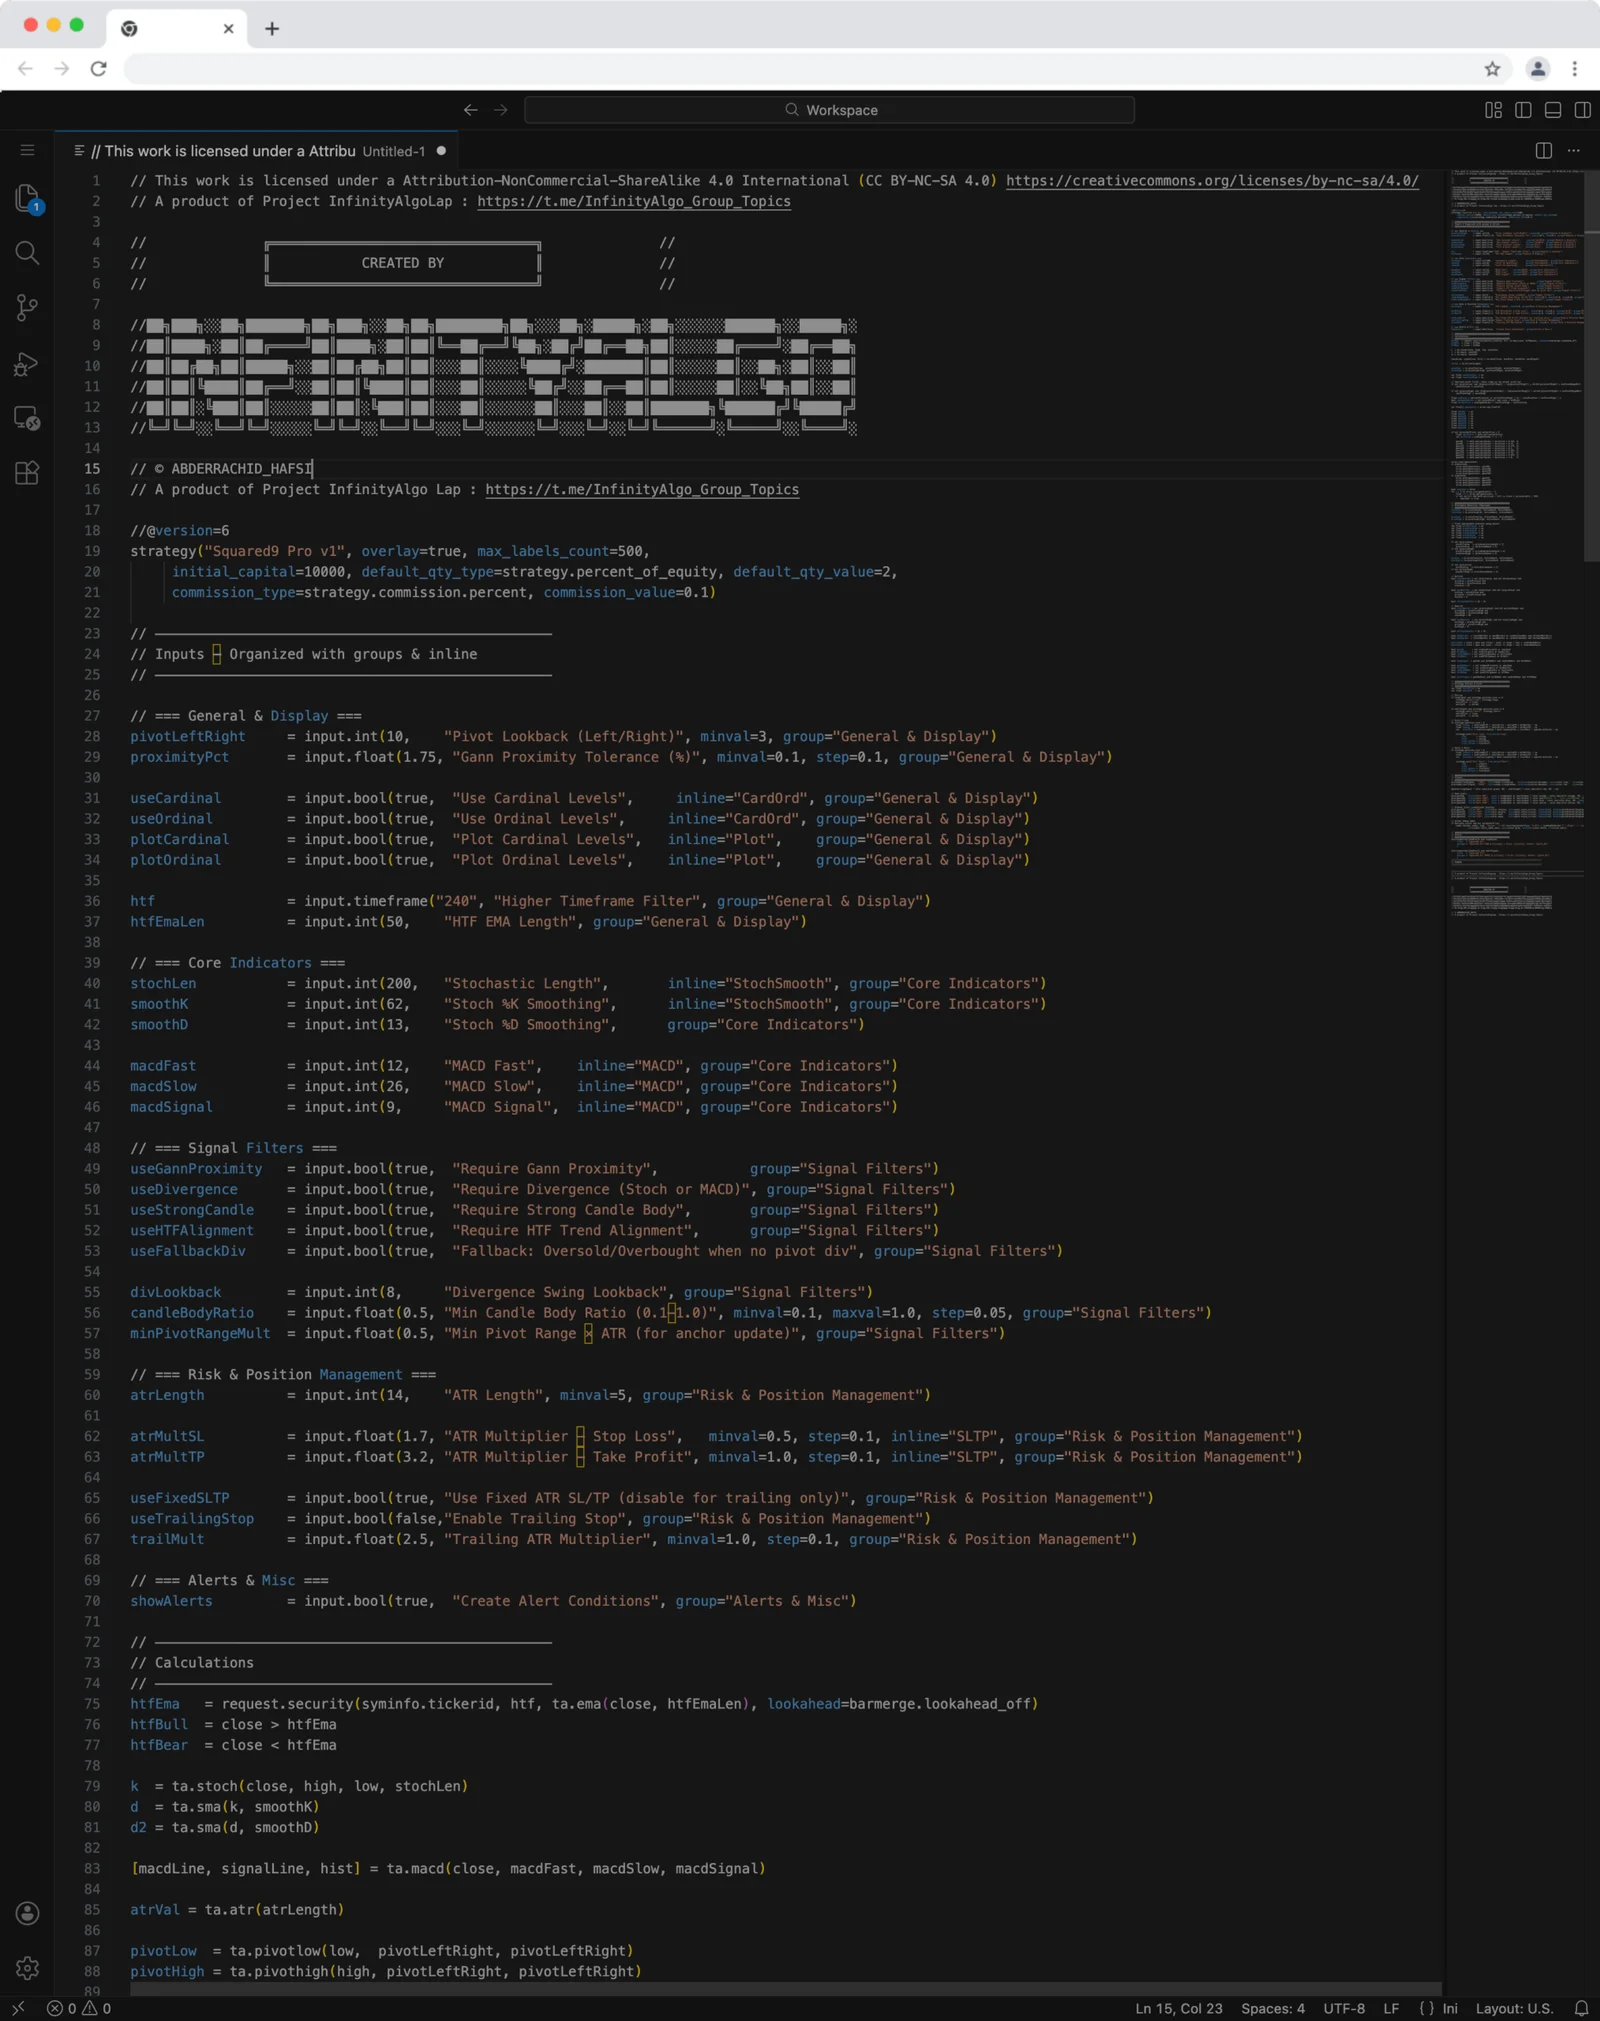
Squared9 Pro v1 Tradingview Free Download - PineScript
Squared9 Pro v1.0 (strategy) combines classic Gann geometry with modern momentum checks to find high-conviction reversal zones.
![Impulse Trend Levels [InfinityAlgo]](https://infinityalgoacademy.net/wp-content/uploads/2026/02/Impulse-Trend-Levels-BOSWaves-—-Indicator-by-BOSWaves-—-TradingView-19-02-2026_19_05-scaled.png)
Impulse Trend Levels [InfinityAlgo]
Impulse Trend Levels [InfinityAlgo] is a momentum-aware trend identification system that tracks directional price movement through adaptive confidence bands, where band width dynamically adjusts based on impulse strength and freshness to reflect real-time conviction in the current trend direction.