
BPR + SFP Indicator ICT in MetaTrader 5 - Free
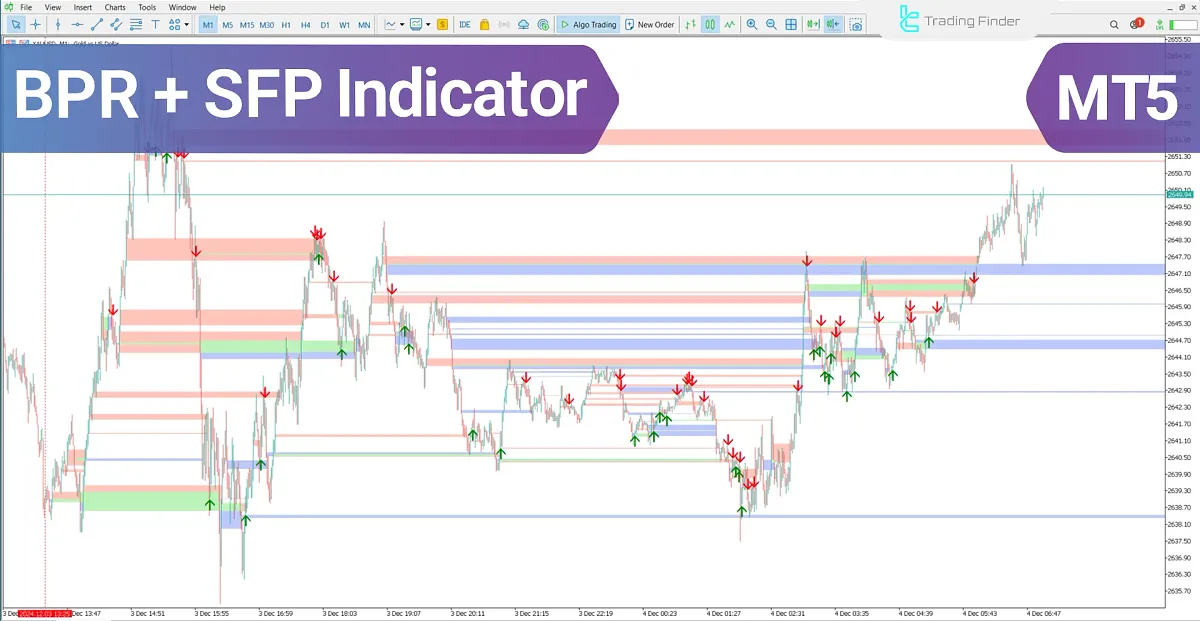
The BPR + SFP Oscillation Breakout Indicator combines the BPR and SFP patterns in technical analysis to identify market trends and pinpoint suitable entry points.
Indicator Overview
The combination of oscillation breakout and BPR patterns in the ICT style enables traders to identify range zones.
These zones are often recognized as key market levels, used for making critical trading decisions.This tool assists traders in entering volatile markets and locating suitable entryand exit points.
Uptrend Conditions
The price chart below displays the Nasdaq 100 Index in a 1-minute timeframe; gray lines represent key price levels.
When the price reaches these levels, a trend change and reversal to a bullish trend are indicated by a green arrow for traders.

Downtrend Conditions
The image below shows the price chart of Australian Dollar against Japanese Yen (AUD/JPY) in a 5-minute timeframe.
Gray lines represent key price levels; when the price reaches these levels, trend change, breakout, and reversal to a bearish trend are indicated by a red arrow for traders.

Indicator Settings
Table below includes information related to the settings of the BPR + SFP Indicator:

- Color theme of chart and object: Chart color theme;
- Candles to check: Candle analysis;
- Object prefix: Classification code;
- SFP mode: SFP mode;
- BPR show: Display BPR;
- BPR SFT show: Display BPR SFT.
Conclusion
The combined BPR and SFP Indicator, incorporating a MT5 Liquidity indicator, is a powerful tool for analyzing key price levels andliquidity, identifying reversal points, oscillation breakouts, and suitable entry and exit points.
Related Products

Dual Structural Trendline Fib Channel Free Download
Dual Structural Trendline Fib Channel is a structural analysis indicator that automatically constructs dual trendline channels using pivot-based slope logic.
![Wedge Pattern [InfinityAlgo] Free Download](https://infinityalgoacademy.net/wp-content/uploads/2026/02/Wedge-Pattern-UAlgo-—-Indicator-by-UAlgo-—-TradingView-22-02-2026_21_34-scaled.png)
Wedge Pattern [InfinityAlgo] Free Download
Wedge Pattern is a chart overlay that detects rising and falling wedge formations using strict pivot based rules and a validation engine that enforces classic technical analysis requirements. The script builds two trendlines from confirmed pivot highs and pivot lows

Volatility Aggregation Model Tradingview
Volatility Aggregation Model (VAM) is a very simple overlay indicator that classifies market direction using a five-speed ensemble of volatility-adaptive range engines. Instead of relying on a single trend filter, VAM evaluates direction across multiple responsiveness settings and converts those states into a normalized score
Quantum Emperor MT4 Free Download
Introducing Quantum Emperor EA, the groundbreaking MQL5 expert advisor that's transforming the way you trade the prestigious GBPUSD pair! Developed by a team of experienced traders with trading experience of over 13 years.
CyNera MT4 Free Download
Trading gold, one of the most volatile instruments in the market, demands precision, in-depth analysis, and strong risk management. CyNera Expert Advisor seamlessly integrates these elements into a sophisticated system designed for optimal gold trading.