
![Buyside & Sellside Liquidity [LuxAlgo]](https://infinityalgoacademy.net/wp-content/uploads/2026/02/Buyside-Sellside-Liquidity-LuxAlgo-.png)
Buyside & Sellside Liquidity [LuxAlgo]
The Buyside & Sellside Liquidity indicator aims to detect & highlight the first and arguably most important concept within the ICT trading methodology, Liquidity levels.
The Buyside & Sellside Liquidity indicator aims to detect & highlight the first and arguably most important concept within the ICT trading methodology, Liquidity levels.
🔶 SETTINGS
🔹 Liquidity Levels
- Detection Length: Lookback period
- Margin: Sets margin/sensitivity for a liquidity level detection
🔹 Liquidity Zones
- Buyside Liquidity Zones: Enables display of the buyside liquidity zones.
- Margin: Sets margin/sensitivity for the liquidity zone boundaries.
- Color: Color option for buyside liquidity levels & zones.
- Sellside Liquidity Zones: Enables display of the sellside liquidity zones.
- Margin: Sets margin/sensitivity for the liquidity zone boundaries.
- Color: Color option for sellside liquidity levels & zones.
🔹 Liquidity Voids
- Liquidity Voids: Enables display of both bullish and bearish liquidity voids.
- Label: Enables display of a label indicating liquidity voids.
🔹 Display Options
- Mode: Controls the lookback length of detection and visualization, where Present assumes last 500 bars and Historical assumes all data available to the user
- # Visible Levels: Controls the amount of the liquidity levels/zones to be visualized.
🔶 USAGE
Definitions of Liquidity refer to the availability of orders at specific price levels in the market, allowing transactions to occur smoothly.
In the context of Inner Circle Trader’s teachings, liquidity mainly relates to stop losses or pending orders and liquidity level/pool, highlighting a concentration of buy or sell orders at specific price levels. Smart money traders, such as banks and other large institutions, often target these liquidity levels/pools to accumulate or distribute their positions.
There are two types of liquidity; Buyside liquidity and Sellside liquidity.
Buyside liquidity represents a level on the chart where short sellers will have their stops positioned, and Sellside liquidity represents a level on the chart where long-biased traders will place their stops.
These areas often act as support or resistance levels and can provide trading opportunities.
When the liquidity levels are breached at which many stop/limit orders are placed have been traded through, the script will create a zone aiming to provide additional insight to figure out the odds of the next price action.
Reversal: It’s common that the price may reverse course and head in the opposite direction, seeking liquidity at the opposite extreme.
Continuation: When the zone is also broken it is a sign for continuation price action.
It’s worth noting that ICT concepts are specific to the methodology developed by Michael J. Huddleston and may not align with other trading approaches or strategies.
🔶 DETAILS
Liquidity voids are sudden changes in price when the price jumps from one level to another. Liquidity voids will appear as a single or a group of candles that are all positioned in the same direction. These candles typically have large real bodies and very short wicks, suggesting very little disagreement between buyers and sellers. The peculiar thing about liquidity voids is that they almost always fill up.
🔶 ALERTS
When an alert is configured, the user will have the ability to be notified in case;
- Liquidity level is detected/updated.
- Liquidity level is breached.
Related Products

Dual Structural Trendline Fib Channel Free Download
Dual Structural Trendline Fib Channel is a structural analysis indicator that automatically constructs dual trendline channels using pivot-based slope logic.
![Wedge Pattern [InfinityAlgo] Free Download](https://infinityalgoacademy.net/wp-content/uploads/2026/02/Wedge-Pattern-UAlgo-—-Indicator-by-UAlgo-—-TradingView-22-02-2026_21_34-scaled.png)
Wedge Pattern [InfinityAlgo] Free Download
Wedge Pattern is a chart overlay that detects rising and falling wedge formations using strict pivot based rules and a validation engine that enforces classic technical analysis requirements. The script builds two trendlines from confirmed pivot highs and pivot lows

Volatility Aggregation Model Tradingview
Volatility Aggregation Model (VAM) is a very simple overlay indicator that classifies market direction using a five-speed ensemble of volatility-adaptive range engines. Instead of relying on a single trend filter, VAM evaluates direction across multiple responsiveness settings and converts those states into a normalized score
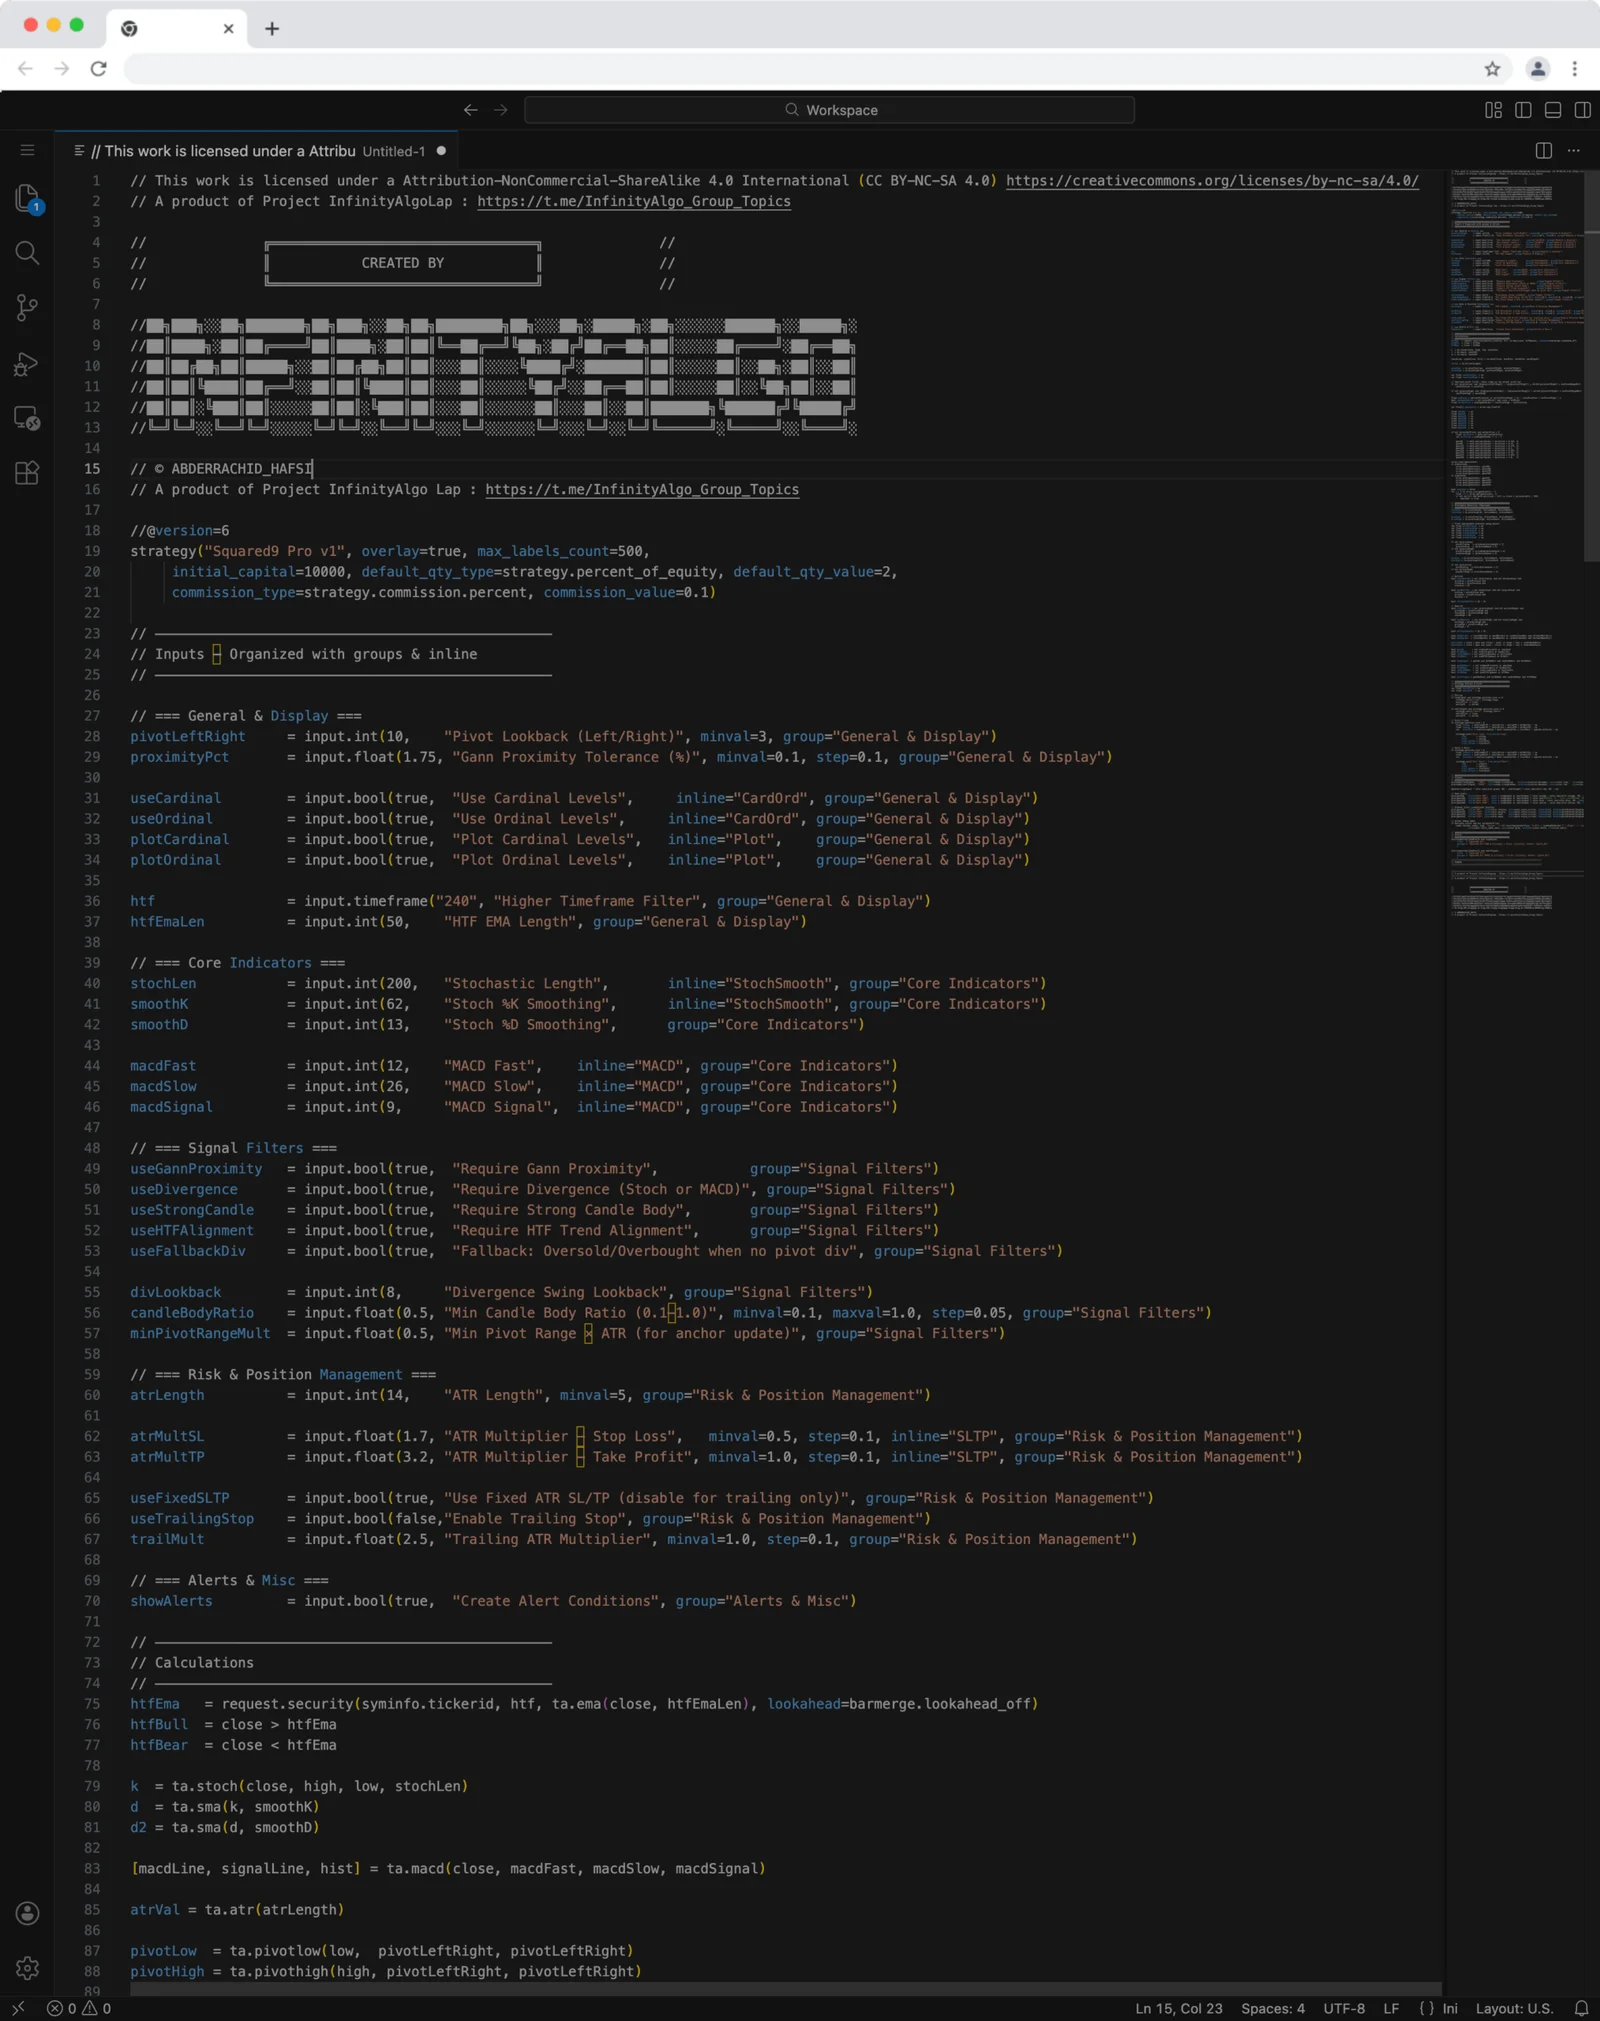
Squared9 Pro v1 Tradingview Free Download - PineScript
Squared9 Pro v1.0 (strategy) combines classic Gann geometry with modern momentum checks to find high-conviction reversal zones.
![Impulse Trend Levels [InfinityAlgo]](https://infinityalgoacademy.net/wp-content/uploads/2026/02/Impulse-Trend-Levels-BOSWaves-—-Indicator-by-BOSWaves-—-TradingView-19-02-2026_19_05-scaled.png)
Impulse Trend Levels [InfinityAlgo]
Impulse Trend Levels [InfinityAlgo] is a momentum-aware trend identification system that tracks directional price movement through adaptive confidence bands, where band width dynamically adjusts based on impulse strength and freshness to reflect real-time conviction in the current trend direction.