
Regression Channel Oscillator - Tradingview Free Download
Regression Channel Oscillator is an oscillator based on linear regression that shows when price moves away from its natural path and when it returns to balance.
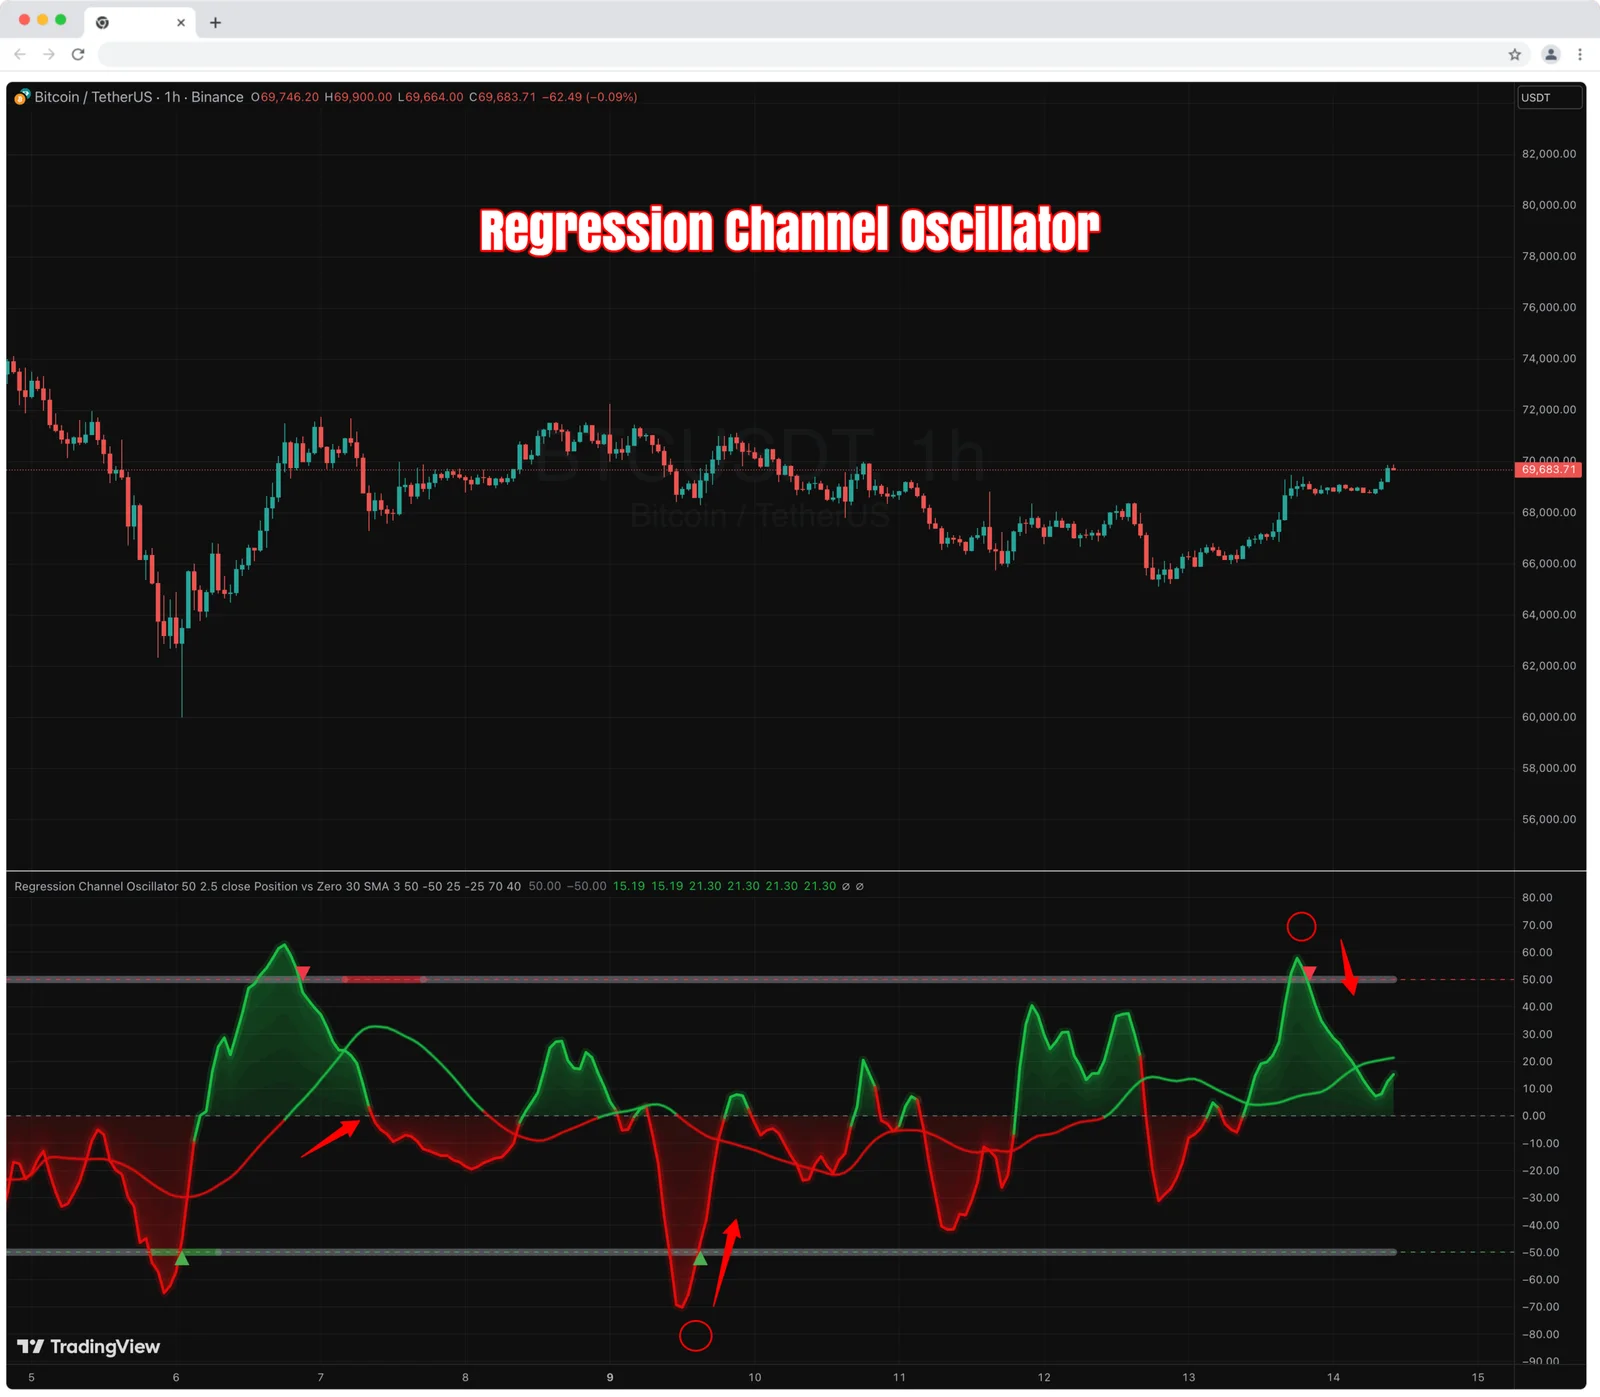
█ OVERVIEW
Regression Channel Oscillator is an oscillator based on linear regression that shows when price moves away from its natural path and when it returns to balance.
Unlike a classic moving average, linear regression does not simply average price — it accounts for direction and speed of movement. As a result, its center better represents the true price path rather than a lagging average.
Advantage over MA:
– detects changes in market dynamics faster
– lags less during trends
– better identifies when a move becomes excessive relative to the current direction
The result: the oscillator more precisely highlights market overextension, not just distance from an average.
█ CONCEPTS
The indicator was created primarily for precise identification of correction areas and potential trend change points, when price moves too far away from its current path.
At the same time, it works very well as:
– a trend-following tool
– a detector of low-volatility phases
When the oscillator line stays near zero and cannot reach OB/OS zones, the market is in balance or compression — often a phase before a larger move.
Strong pushes into extreme zones show that the market has temporarily moved away from its natural path.
█ FEATURES
Regression Settings
– Regression Length – defines how broadly the current price path is measured
– RMSE Multiplier – controls oscillator sensitivity to deviations
Oscillator
– Shows how far price has moved away from its current path
– Range is limited for readability
– Optional smoothing: SMA / EMA / None
Signal Settings
– Signal MA – moving average of the oscillator used for momentum confirmation
– Show Signal MA – option to enable or disable the signal line entirely
– Signal Color Mode
– Direction – color changes based on slope
– Position vs Zero – color changes based on position relative to zero
– Signal SMA Length – length of the signal moving average
Overbought / Oversold Zones
– Configurable OB/OS levels for the oscillator
– Additional hidden OB/OS thresholds for the Signal MA (signal line)
– When SMA crosses these thresholds, the main OB/OS zones change color — providing additional confirmation of potential direction change or move exhaustion
Dynamic Colors
– Oscillator above 0 → bullish
– Below 0 → bearish
Gradients & Visualization
– Oscillator gradient
– Multi-layer SMA gradient
– OB/OS zone gradients
– Gradient fill toward the zero line
– Full visual customization
Signals
– Signal appears when leaving extreme zones
Alerts
– Alerts for exits from OB/OS zones
█ HOW TO USE
Add the indicator in TradingView → Regression Channel Oscillator
or copy the code and paste it into the Pine Editor.
This tool helps determine whether price is moving in a healthy trend rhythm or is already overextended relative to its current path.
It helps distinguish three market states:
– Stable trend – oscillator stays on one side of zero
– Overextended move – entries into OB/OS zones
– Compression / no direction – oscillator moves around the zero line
Shorter settings → faster reaction (intraday, scalping)
Longer settings → more stable readings (swing, higher timeframes)
█ APPLICATIONS
Corrections in trend
When the market is trending, entries into extreme zones often mark moments where the move has become stretched and a pullback may occur.
In strong impulses, however, this state can persist for a long time — trying to catch the end of the move can be risky.
Trend following
When the oscillator remains on one side of zero, it indicates the dominant market side.
Low-volatility phases
When the oscillator stays near zero and does not reach OB/OS zones, the market is in balance or accumulation before a larger move.
Momentum confirmation
When the Signal MA crosses its additional OB/OS thresholds, the main extreme zones change color. This visual confirmation suggests that the move may be nearing exhaustion or that the probability of a direction change is increasing.
█ NOTES
– In strong trends, the oscillator may stay in extreme zones for extended periods — this reflects strength, not an immediate reversal.
– OB/OS levels should be adjusted to the instrument and timeframe.
– Works best when combined with market structure, trend analysis, and support/resistance levels.
Related Products

Dual Structural Trendline Fib Channel Free Download
Dual Structural Trendline Fib Channel is a structural analysis indicator that automatically constructs dual trendline channels using pivot-based slope logic.
![Wedge Pattern [InfinityAlgo] Free Download](https://infinityalgoacademy.net/wp-content/uploads/2026/02/Wedge-Pattern-UAlgo-—-Indicator-by-UAlgo-—-TradingView-22-02-2026_21_34-scaled.png)
Wedge Pattern [InfinityAlgo] Free Download
Wedge Pattern is a chart overlay that detects rising and falling wedge formations using strict pivot based rules and a validation engine that enforces classic technical analysis requirements. The script builds two trendlines from confirmed pivot highs and pivot lows

Volatility Aggregation Model Tradingview
Volatility Aggregation Model (VAM) is a very simple overlay indicator that classifies market direction using a five-speed ensemble of volatility-adaptive range engines. Instead of relying on a single trend filter, VAM evaluates direction across multiple responsiveness settings and converts those states into a normalized score
Quantum Emperor MT4 Free Download
Introducing Quantum Emperor EA, the groundbreaking MQL5 expert advisor that's transforming the way you trade the prestigious GBPUSD pair! Developed by a team of experienced traders with trading experience of over 13 years.
CyNera MT4 Free Download
Trading gold, one of the most volatile instruments in the market, demands precision, in-depth analysis, and strong risk management. CyNera Expert Advisor seamlessly integrates these elements into a sophisticated system designed for optimal gold trading.