
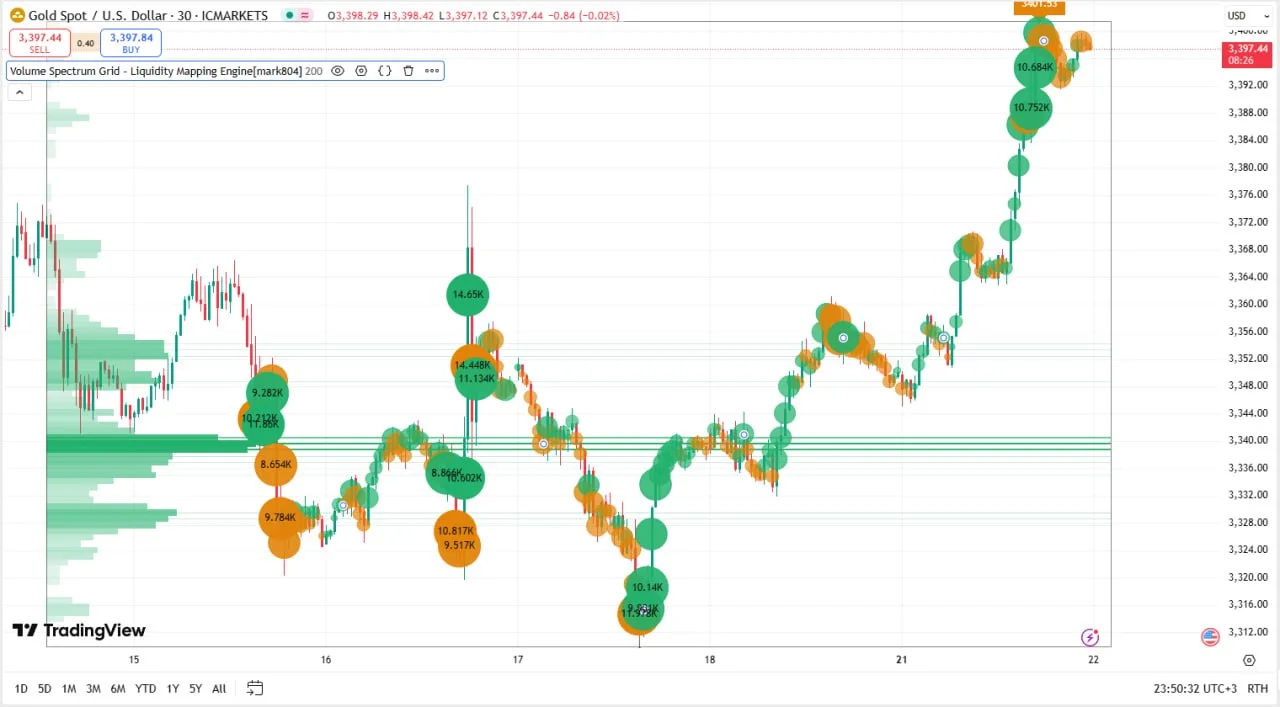
Volume Spectrum Grid – Liquidity Mapping Engine
The Volume Spectrum Grid – Liquidity Mapping Engine is a sophisticated TradingView indicator designed to visualize volume distribution, liquidity concentrations, and institutional price interest directly on the chart.
Advanced Volume Profile, Liquidity Zones, and Institutional Interest Visualization
Introduction
The Volume Spectrum Grid – Liquidity Mapping Engine is a sophisticated TradingView indicator designed to visualize volume distribution, liquidity concentrations, and institutional price interest directly on the chart.
Instead of relying on traditional horizontal volume profiles, this system builds a dynamic price–volume grid, allowing traders to see where the market has truly accepted price and where liquidity is concentrated.
This tool is particularly effective for smart money trading, mean reversion strategies, breakout confirmation, and liquidity-based entries.
1. Core Concept: Volume Normalization
At the foundation of this indicator is normalized volume analysis.
-
Raw volume is normalized using standard deviation
-
This allows fair comparison between low-volume and high-volume periods
-
Abnormally high volume immediately stands out
Each candle is classified into volume intensity tiers:
-
Low volume
-
Average volume
-
High volume
-
Very high volume
-
Extreme (institutional-grade) volume
This normalization removes market noise and highlights true participation.
2. Volume Bubble Visualization
The indicator plots volume bubbles directly on price:
-
Bubble size represents relative volume intensity
-
Bubble color reflects bullish or bearish dominance
-
Gradient coloring highlights transitions from normal to extreme volume
Interpretation
-
Small bubbles → Low participation / consolidation
-
Large bubbles → Institutional activity
-
Clusters of large bubbles → Accumulation or distribution zones
This allows traders to visually identify where the market is being actively defended or attacked.
3. Spectrum Grid & Price Binning
Instead of using fixed levels, the indicator:
-
Divides the recent price range into 100 adaptive price bins
-
Accumulates traded volume per price segment
-
Builds a volume spectrum grid across the entire lookback period
This creates a high-resolution liquidity map, showing exactly where volume has been absorbed.
4. Volume Profile Construction
For each price bin:
-
Volume is aggregated and normalized
-
Horizontal bars are drawn to represent relative acceptance
-
Bar width reflects volume dominance at that price
This produces a horizontal volume profile embedded into the chart, aligned with real price structure rather than static sessions.
5. Liquidity Levels & Point of Control (POC)
The system automatically detects high-volume price levels:
-
Levels with dominant volume are highlighted as liquidity zones
-
These levels often act as:
-
Support
-
Resistance
-
Re-accumulation zones
-
Re-distribution zones
-
Thicker and more intense lines indicate stronger institutional interest.
6. High & Low Extremes Labeling
The indicator also identifies:
-
The highest high within the lookback
-
The lowest low within the lookback
These extremes are labeled automatically, giving traders immediate awareness of:
-
Range boundaries
-
Stop-hunt zones
-
Potential breakout or reversal levels
7. Smart Lookback Control
All calculations are limited to a user-defined lookback window:
-
Prevents chart clutter
-
Ensures relevance to current market context
-
Keeps the indicator fast and responsive
Older data is ignored, allowing the trader to focus on recent liquidity behavior.
8. Visual Clarity & Performance Optimization
Key design choices include:
-
Dynamic object creation only on the last bar
-
Automatic cleanup of old boxes and lines
-
Adjustable display toggles for:
-
Volume bubbles
-
Volume profile
-
Liquidity levels
-
This ensures high performance, even on lower timeframes.
9. Practical Trading Applications
This indicator excels when combined with:
-
Supply & Demand zones
-
Market structure analysis
-
Mean reversion systems
-
Breakout and fake-breakout strategies
Common Use Cases
-
Identify high-probability support and resistance
-
Detect institutional accumulation or distribution
-
Confirm breakouts with volume acceptance
-
Fade price moves into high-liquidity zones
-
Align entries with volume confirmation
Conclusion
The Volume Spectrum Grid – Liquidity Mapping Engine transforms raw volume data into a clear institutional liquidity map.
By revealing where the market truly trades and accepts price, it allows traders to move beyond indicators and into context-driven decision-making.
This is not a signal generator, but a professional analytical framework for traders who want to understand why price moves—not just where.
Related Products

Dual Structural Trendline Fib Channel Free Download
Dual Structural Trendline Fib Channel is a structural analysis indicator that automatically constructs dual trendline channels using pivot-based slope logic.
![Wedge Pattern [InfinityAlgo] Free Download](https://infinityalgoacademy.net/wp-content/uploads/2026/02/Wedge-Pattern-UAlgo-—-Indicator-by-UAlgo-—-TradingView-22-02-2026_21_34-scaled.png)
Wedge Pattern [InfinityAlgo] Free Download
Wedge Pattern is a chart overlay that detects rising and falling wedge formations using strict pivot based rules and a validation engine that enforces classic technical analysis requirements. The script builds two trendlines from confirmed pivot highs and pivot lows

Volatility Aggregation Model Tradingview
Volatility Aggregation Model (VAM) is a very simple overlay indicator that classifies market direction using a five-speed ensemble of volatility-adaptive range engines. Instead of relying on a single trend filter, VAM evaluates direction across multiple responsiveness settings and converts those states into a normalized score
Quantum Emperor MT4 Free Download
Introducing Quantum Emperor EA, the groundbreaking MQL5 expert advisor that's transforming the way you trade the prestigious GBPUSD pair! Developed by a team of experienced traders with trading experience of over 13 years.
CyNera MT4 Free Download
Trading gold, one of the most volatile instruments in the market, demands precision, in-depth analysis, and strong risk management. CyNera Expert Advisor seamlessly integrates these elements into a sophisticated system designed for optimal gold trading.